¶ Description
Scatter plot.
¶ Parameters
¶ Parameters tab
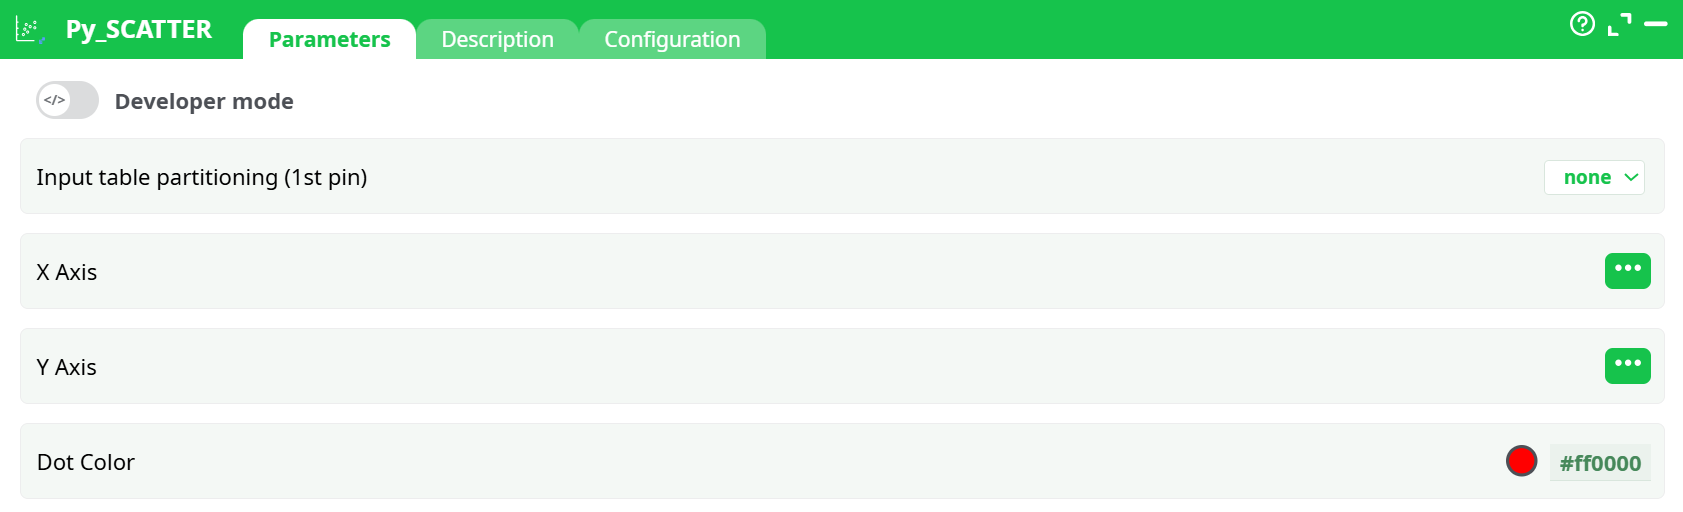
Parameters:
- X Axis
- Y Axis
- Dot Color
¶ Description tab
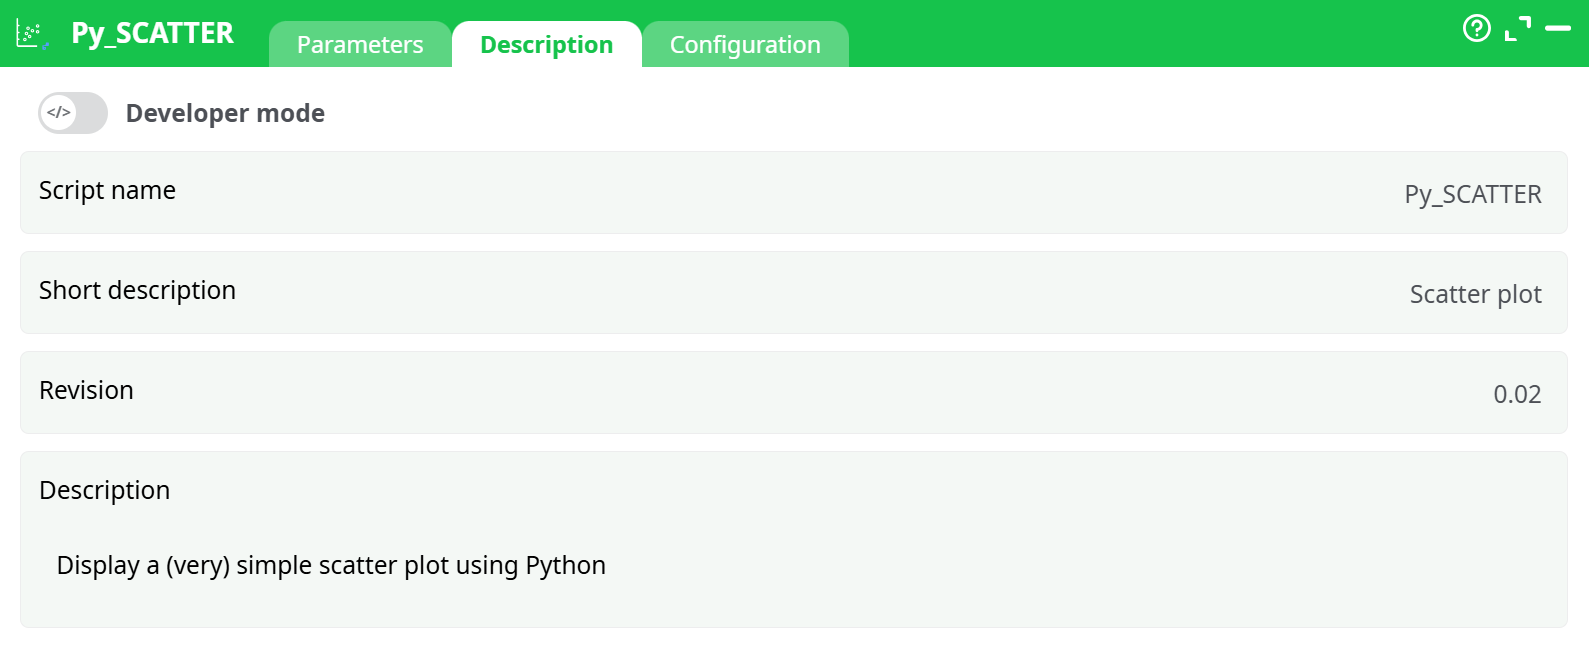
Parameters:
Parameters:
- Script name
- Short description
- Revision
- Decription
¶ Configuration tab
See dedicated page for more information.
¶ About
Py_SCATTER is a Python-based visualization action button designed to render a basic scatter plot. It uses the matplotlib library internally and is intended for rapid visual debugging or analysis of data trends in two dimensions.
This node provides a quick visual summary of the relationship between two numeric variables (X Axis and Y Axis) and optionally allows you to color dots by a fixed color code.
¶ Output
The output of this node is typically a scatter plot image, but:
- It requires an embedded or internal Python script to generate and save the image (e.g.,
scatter.png). - If no Python code is executed internally, no output will be produced, even though the pipeline shows as “successful.”
¶ Internal Behavior
By default, the action assumes:
- An internal Python engine (Matplotlib).
- Script is available inside the node to:
- Render the scatter plot.
- Save output as
.png.