¶ Description
Aggregate a table and display the variables content in a Histogram chart.
¶ Parameters
¶ Parameters tab
Parameters:
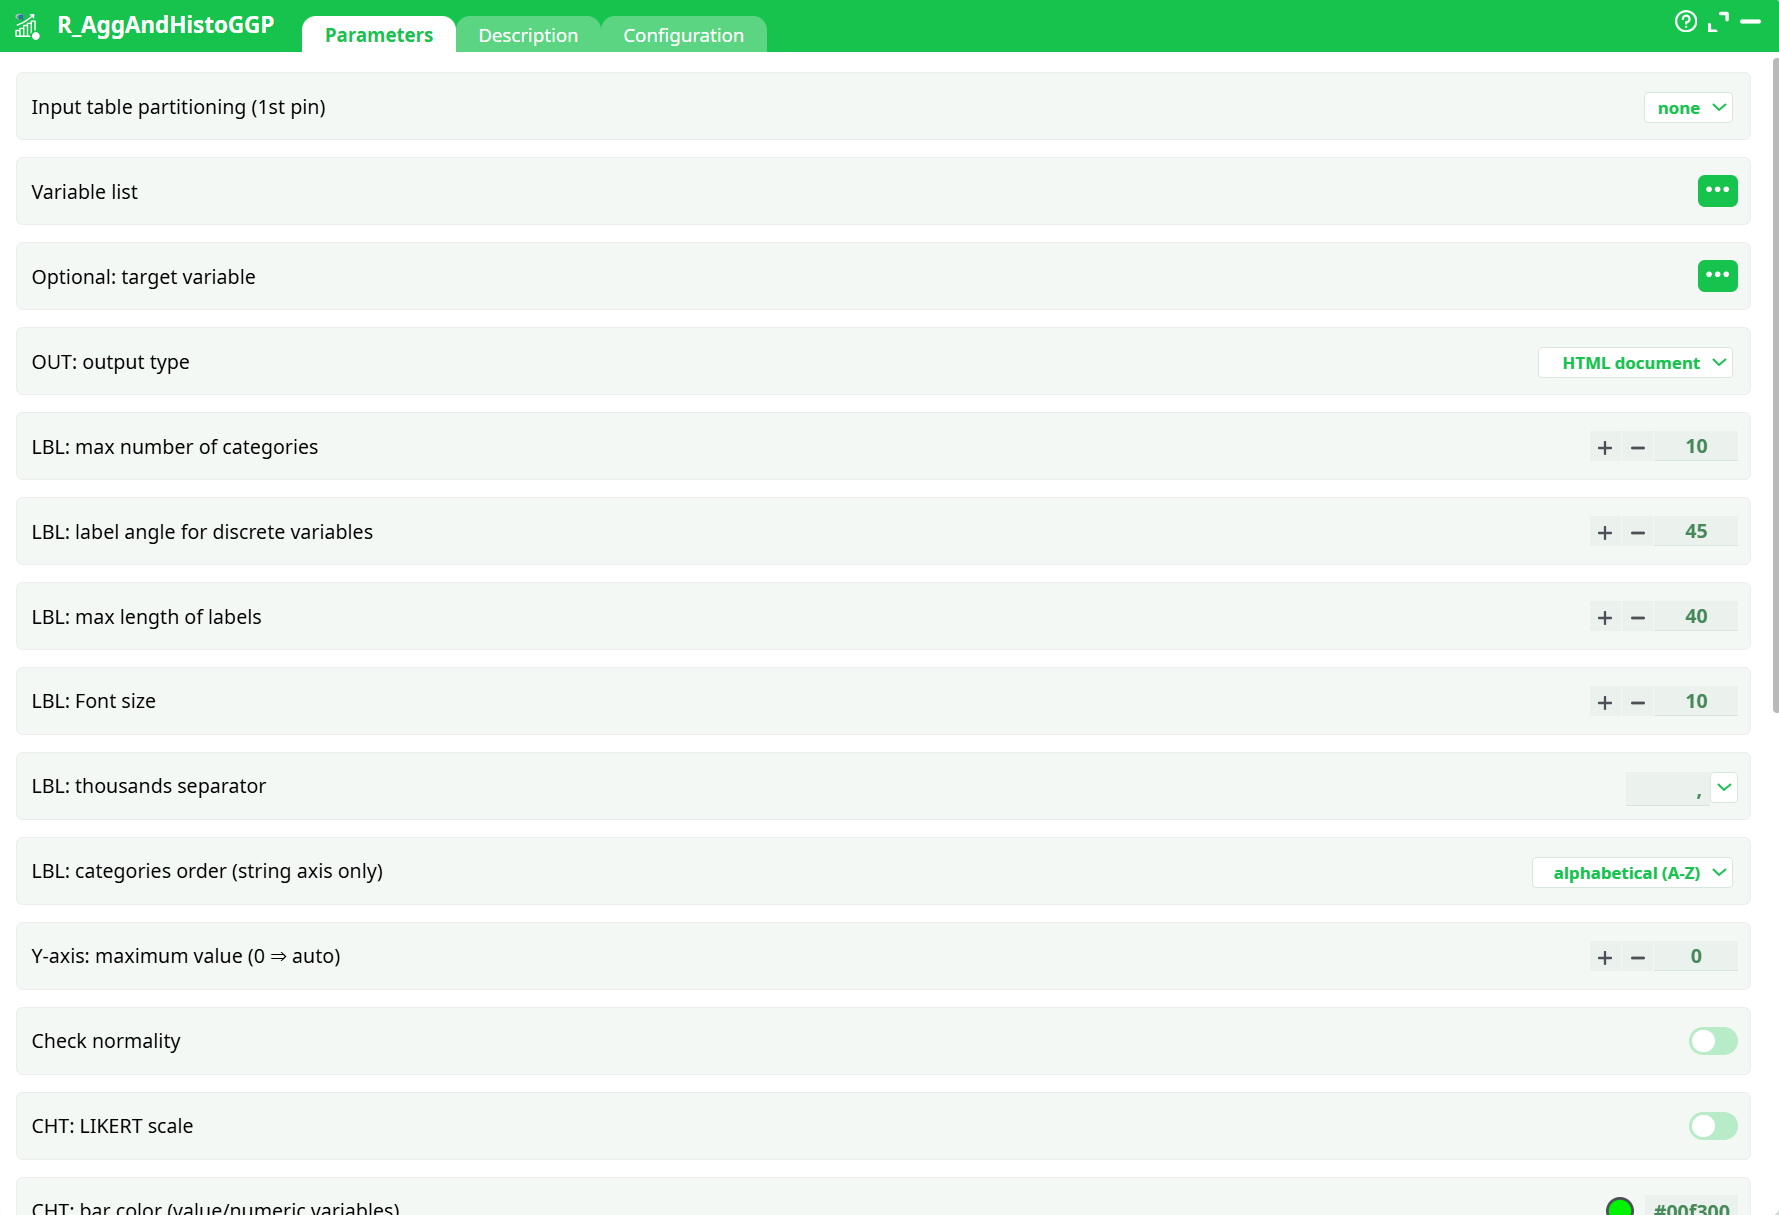
- Input table partitioning (1st pin)
- Variable list
- Optional target variable
- OUT: output type
- LBL: max number of categories
- LBL: label angle for discrete variables
- LBL: max length of labels
- LBL: Font size
- LBL: thousands separator
- LBL: categories order (string axis only)
- Y axis:maximum value (0=auto)
- Check normality
- CHT: LIKERT scale
- CHT: bar color (value/numeric variables
- CHT: bar color (nominal/categorical variables)
- CHT: target line color
- CHT: chart orientation?
- CHT: all plots in one window
- CHT: number of charts per line (for multi plot window)
- CHT: max number of rows per plot
- Silent mode (no log)
- Multiplot PNG width (pixel)
- Multiplot PNG height (pixel)
- a short description
¶ Description tab
Parameters:
- Script name
- Short description
- Revision
- Description
¶ Configuration tab
See dedicated page for more information.
¶ About
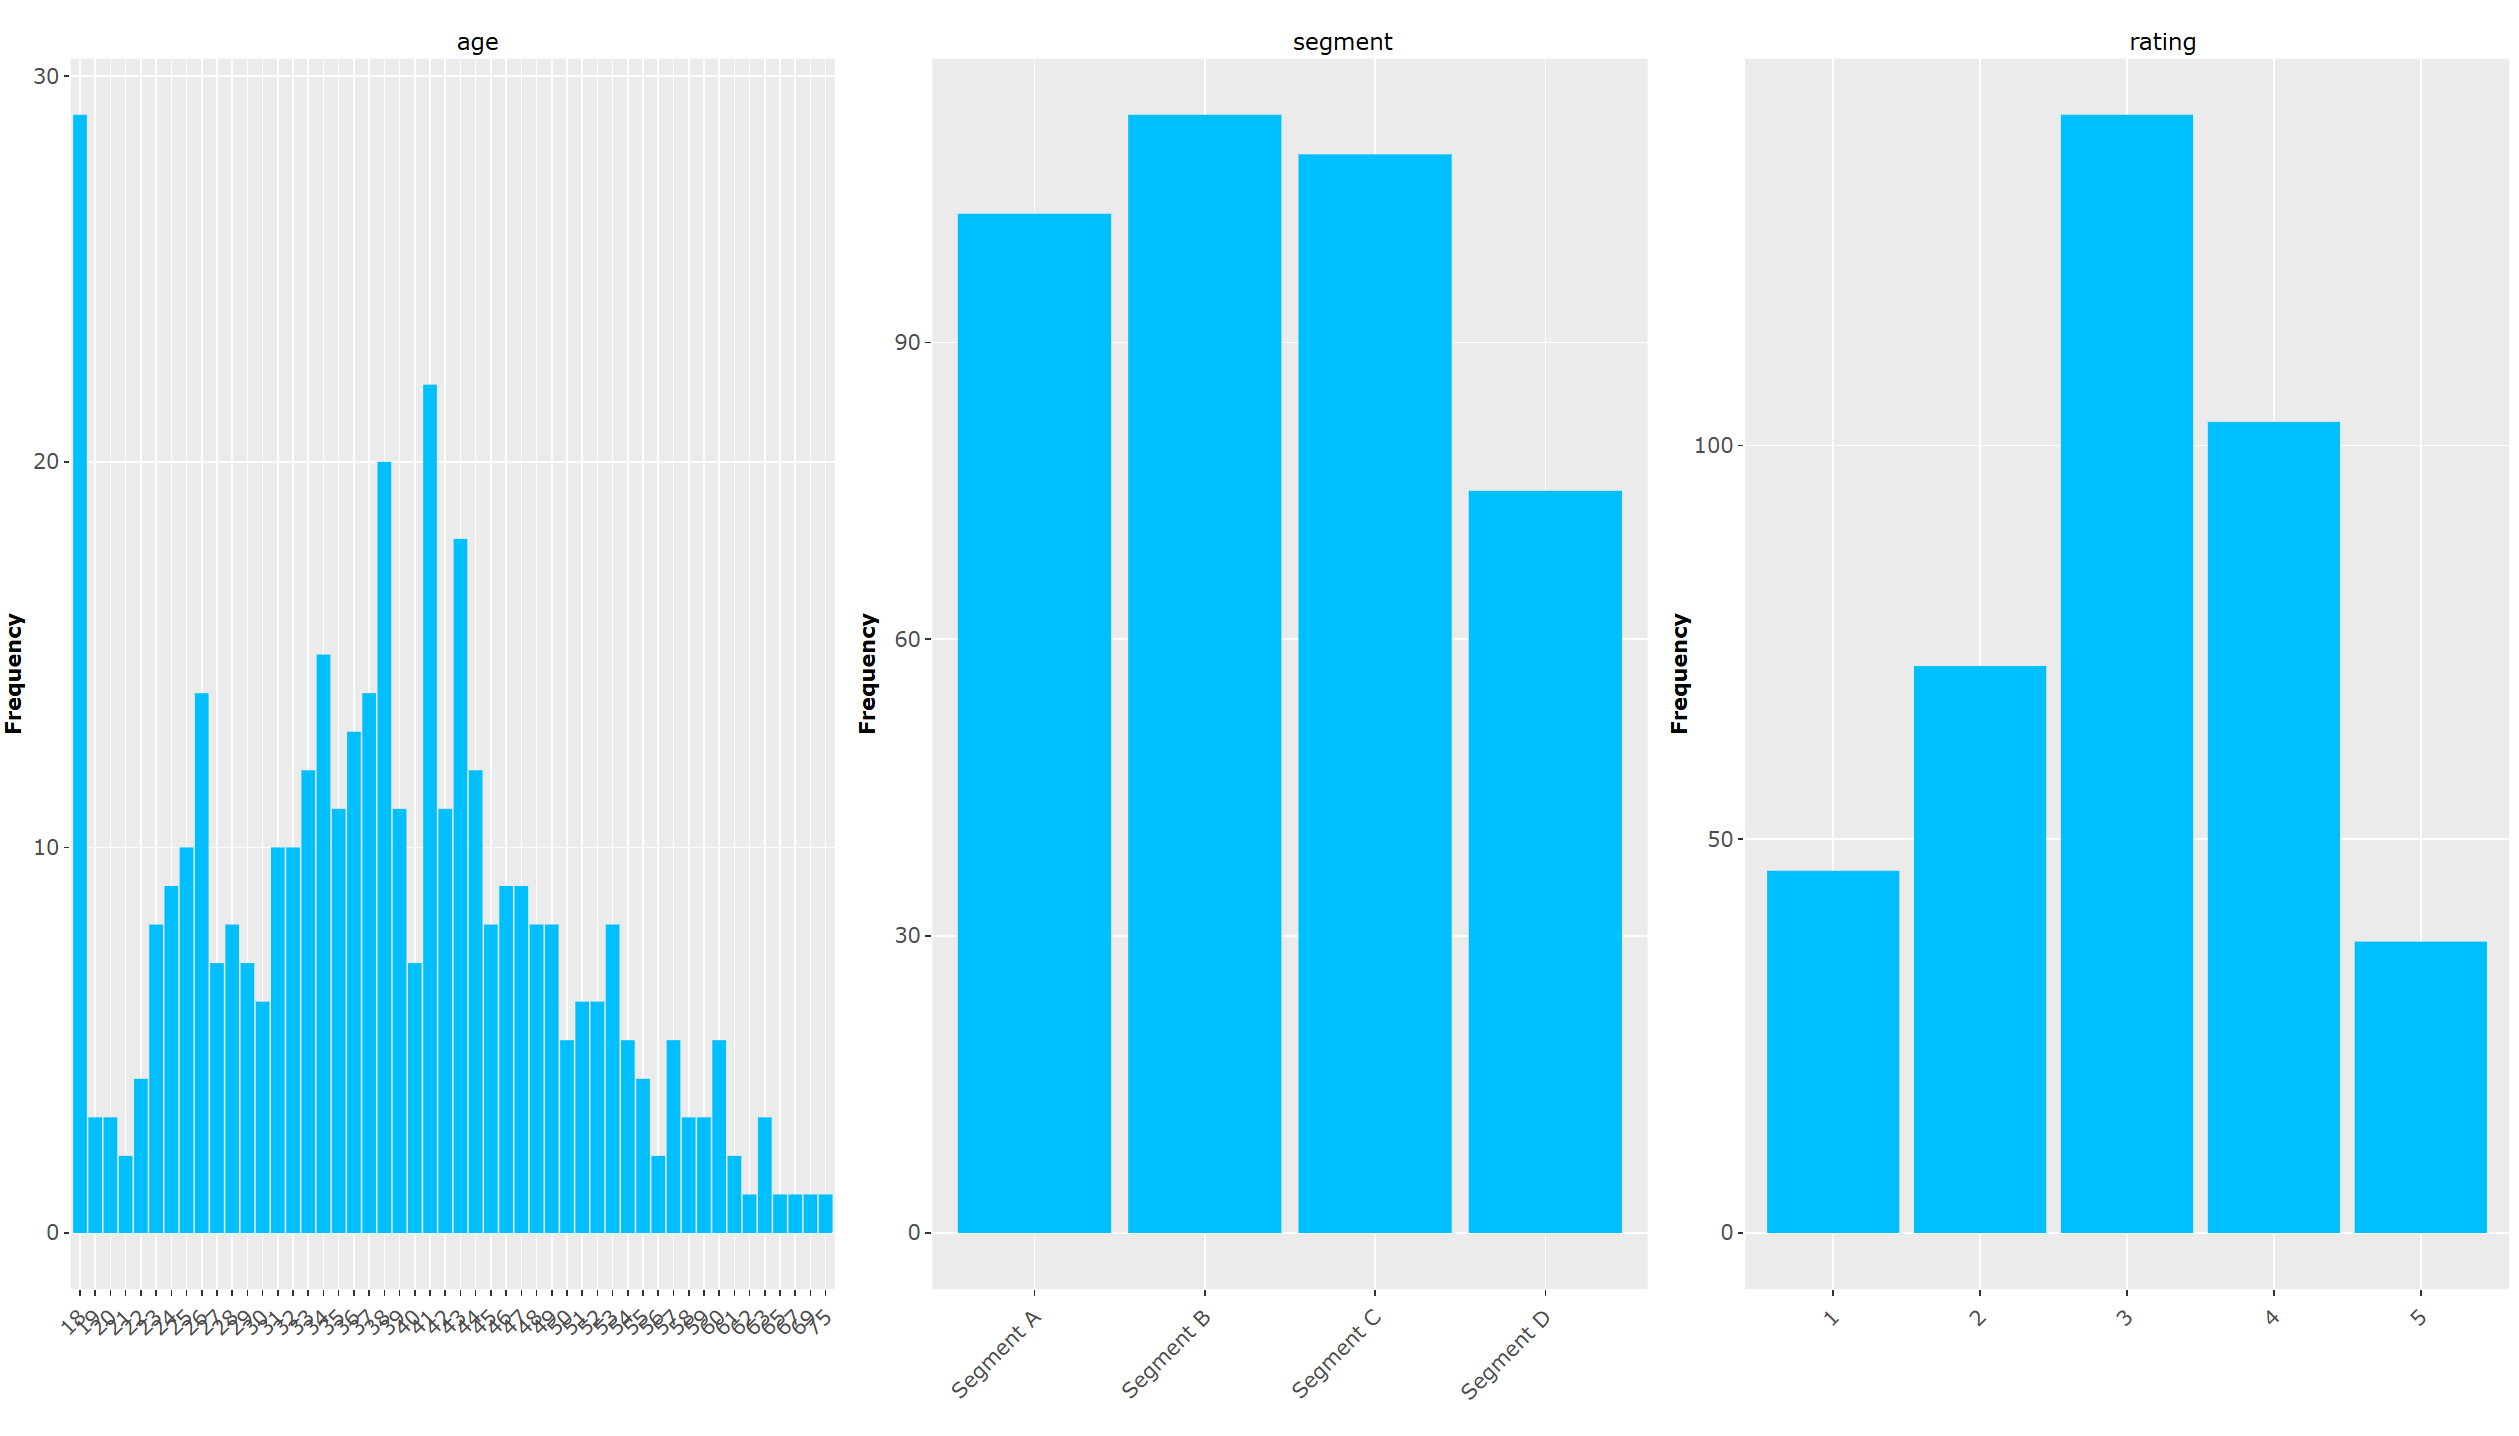
R_AggAndHistoGGP builds, in one pass, a gallery of univariate distributions from a table:
- Numeric fields → histograms (bin counts).
- Categorical/nominal fields → bar charts (category counts).
- Ordinal/Likert fields → bar charts with Likert-friendly options.
- Optionally overlays a target reference line and (when enabled) a normality check for numeric variables.
It runs in the R engine with ggplot2, so it’s ideal for small-to-medium tables (what can fit comfortably in RAM). For very large data, aggregate upstream or use a streaming histogram operator.
¶ Inputs & outputs
Inputs
- Pin 1 (table): the dataset to profile. Partitioning (top-right selector) is supported; when enabled, the operator produces one set of plots per partition.
- Variable list: choose which columns to visualize (picker).
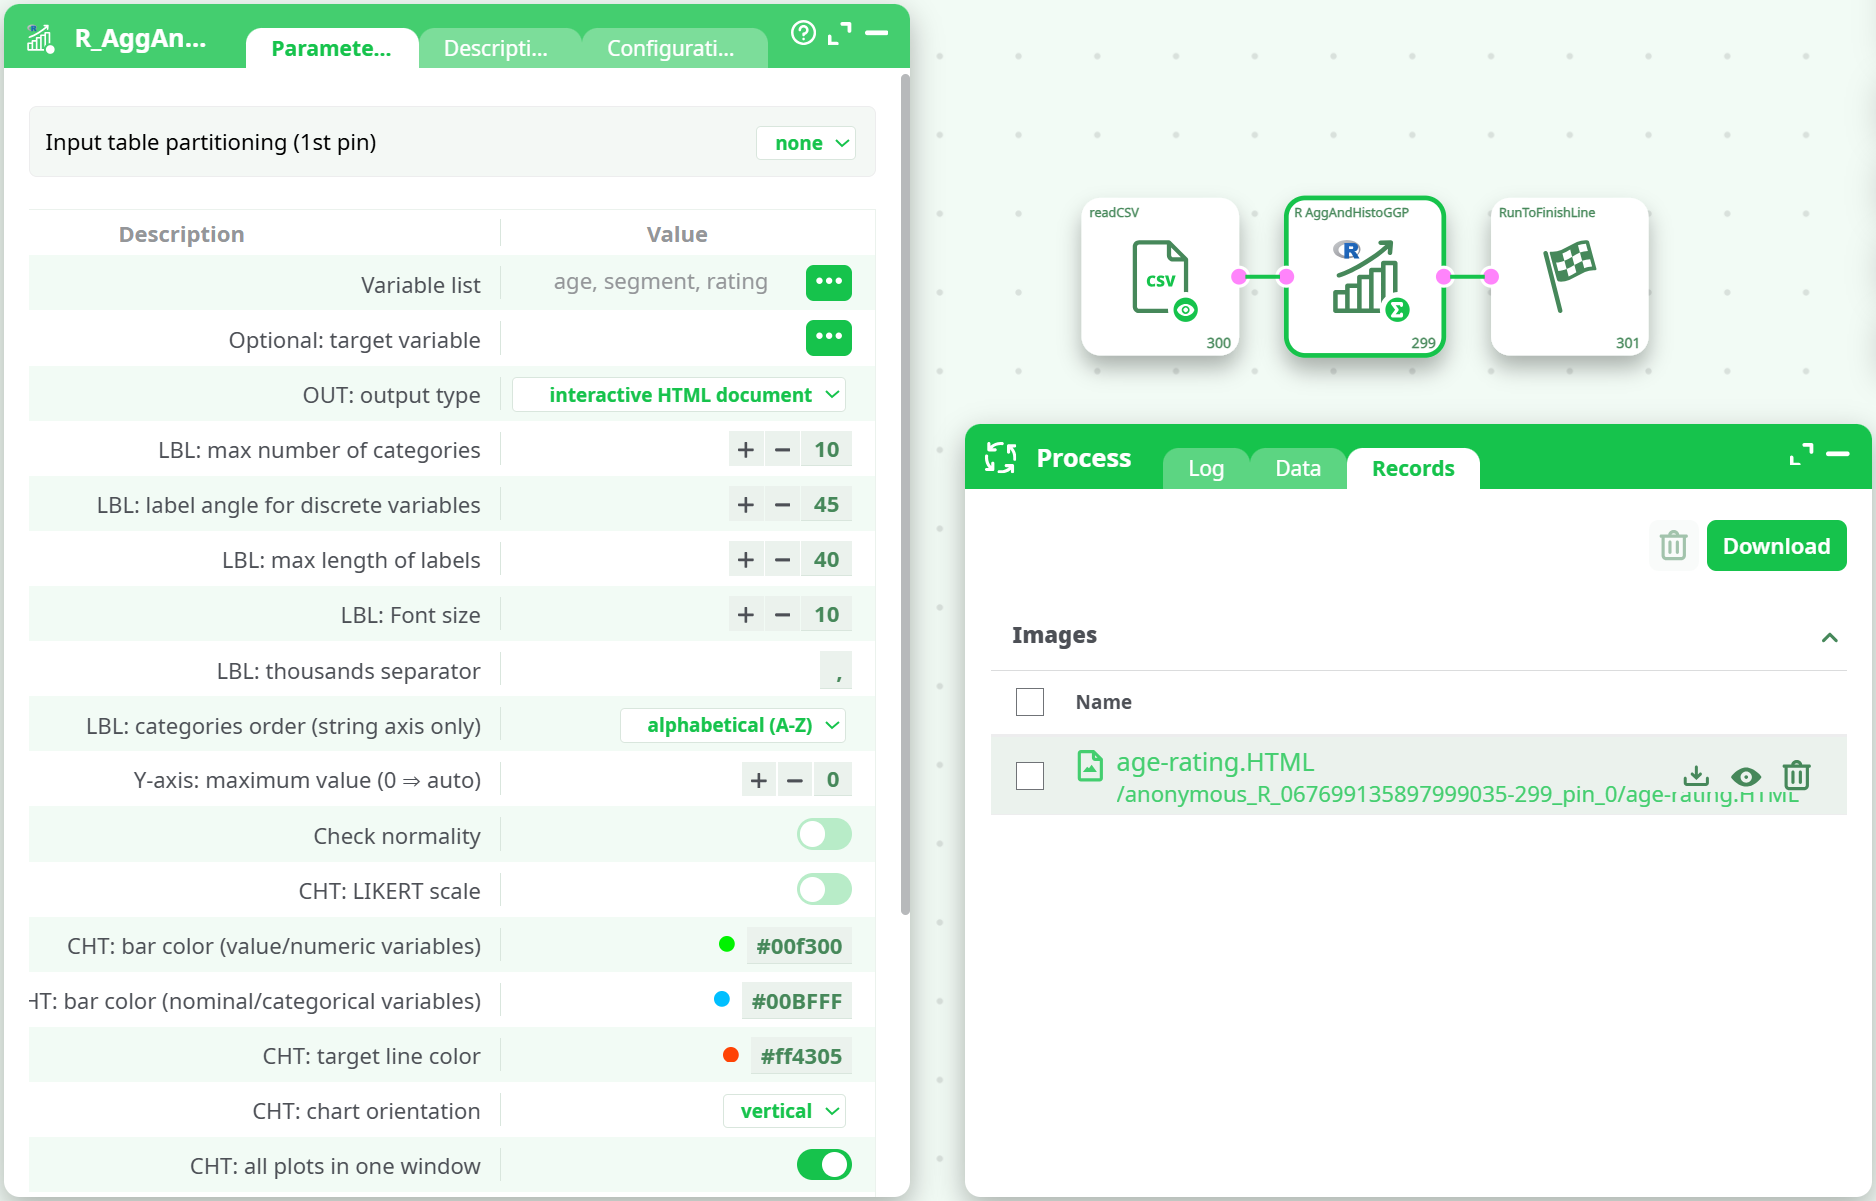
Outputs
- One interactive HTML document containing all plots (default), static HTML, or PNG images (per-plot), depending on OUT: output type and configuration.
- Files are emitted on the Records tab; logs and normality summaries appear on Log.
¶ How it works (pipeline logic)
-
Reads the input table (and, if partitioned, iterates by partition).
-
For each selected variable:
- Detects its type (numeric vs categorical/ordered).
- Builds either a histogram (numeric) or a bar chart (categorical).
- Applies binning / category capping, label formatting, colors, and ordering.
- Optionally overlays a target reference and/or runs a normality check (numeric only).
-
Arranges plots in a grid (single window) or as separate files according to the layout options.
-
Saves to the requested output format.
¶ Parameter reference (Parameters tab)
-
Variable list (
idxVars)
Columns to chart. You can mix numeric, categorical and ordinal/Likert. -
Optional: target variable (
idxTarget)
A numeric or integer column used as a reference line in numeric histograms and as a target line color (see TargetColor). -
OUT: output type (
idOutput)- interactive HTML document (default)
- HTML document
- (PNG export is available from the Configuration tab; see “Export & runtime options”)
-
LBL: max number of categories (
nbreak)- Numeric: maximum number of bins.
- Categorical: maximum number of categories to display (remaining may be grouped).
-
LBL: label angle for discrete variables (
Xangle)
Rotate x-axis labels (degrees) for readability. -
LBL: max length of labels (
idMaxLen)
Truncates long category labels to the given character count. -
LBL: Font size (
FS)
Text size for labels (chart titles and axes). -
LBL: thousands separator (
idBM)
Character used when formatting tick labels (e.g., “,” or a space). -
LBL: categories order (string axis only) (
idSort)- none
- alphabetical (A–Z) / alphabetical (Z–A)
- increasing / decreasing (by frequency/value)
-
Y-axis: maximum value (0 ⇒ auto) (
idScale)
Clamp the y-axis to a given upper bound, or keep automatic scaling. -
Check normality (
idxNormal)
For numeric variables: draws a normal curve and prints a normality check summary in the Log. -
CHT: LIKERT scale (
idLikert)
Treats integer-coded ordinal variables as Likert (centered display, consistent spacing). -
CHT: bar color (value/numeric variables) (
numColor) -
CHT: bar color (nominal/categorical variables) (
nomColor) -
CHT: target line color (
TargetColor) -
CHT: chart orientation (
idxH)
vertical (default) or horizontal bar orientation. -
CHT: all plots in one window (
idxOneW)
When on, combine plots into a single multi-panel page; otherwise, one output per variable. -
CHT: number of charts per line (
idxColNum)
Grid columns when using a multi-panel layout. -
CHT: max number of rows per plot (
idxRowNum)
Grid rows cap (multi-panel layout). -
Optional: file suffix (
idxSuffix)
Appended to output filenames (useful when you version runs). -
Multiplot width [pixel] (
idW), Multiplot height [pixel] (idHt)
Canvas size for multi-panel outputs (HTML/PNG).
¶ Export & runtime options (Configuration tab)
Depending on your build, the Configuration tab exposes extra runtime toggles:
- IMG Run-only mode: render without displaying (useful in scheduled runs).
- IMG Save images as PNG: persists individual plots as PNG files in addition to HTML.
- IMG PNG directory: where to write PNGs (defaults to the current working directory).
- Silent mode (no log): reduces verbosity in the Log.
¶ Data typing & behavior
- Numeric: histogram with
nbreakbins; can overlay a normal curve and reference line. - Categorical (string/factor): bar chart; you can cap categories (
nbreak), truncate labels, and control order. - Ordinal/Likert: enable LIKERT scale to enforce consistent, ordered display.
- Dates: if treated as strings, they’ll be binned as categories; pre-convert to numeric period (e.g., year) if you want a histogram.
¶ Layout & interaction
- Single, interactive HTML is great for documentation: scroll, zoom, and inspect counts.
- Multi-panel controls (
idxOneW,idxColNum,idxRowNum,idW,idHt) give you fine control for dashboards and reports. - Axis readability: combine
Xangle,idMaxLen, andFSwhen you have long labels or many small categories.
¶ Performance notes
-
The operator runs in R memory. If you hit memory limits:
- Pre-aggregate or sample upstream.
- Reduce
nbreak(fewer bins/categories). - Limit the Variable list to the columns you truly need.
- Use Silent mode to cut logging overhead.
-
Partitioning creates one set of plots per partition; be mindful of the total number of files.
¶ Troubleshooting
- No plots emitted / empty HTML
Ensure at least one variable is selected in Variable list and the table has rows after any upstream filters. - “Out of memory” / very slow
Decreasenbreak, reduce selected variables, or aggregate upstream. Consider running by partitions. - Normality option does nothing
Works only on numeric columns; disable it for categorical variables. - Target line not shown
Set Optional: target variable and verify it’s numeric; choose a visible TargetColor. - Overlapping or unreadable labels
IncreaseFS, shorten labels viaidMaxLen, rotate withXangle, or switch to horizontal orientation.
¶ When to use this operator
- Quick, multi-field distribution audit during data discovery.
- Building profiling appendices for analysis reports (interactive HTML).
- Producing publishing-ready PNGs for static documentation.