¶ Description
Build a cross tab table for frequencies or means, with or without significance tests. This is equivalent to the Custom Tables from SPSS.
¶ Properties window
¶ Parameters tab
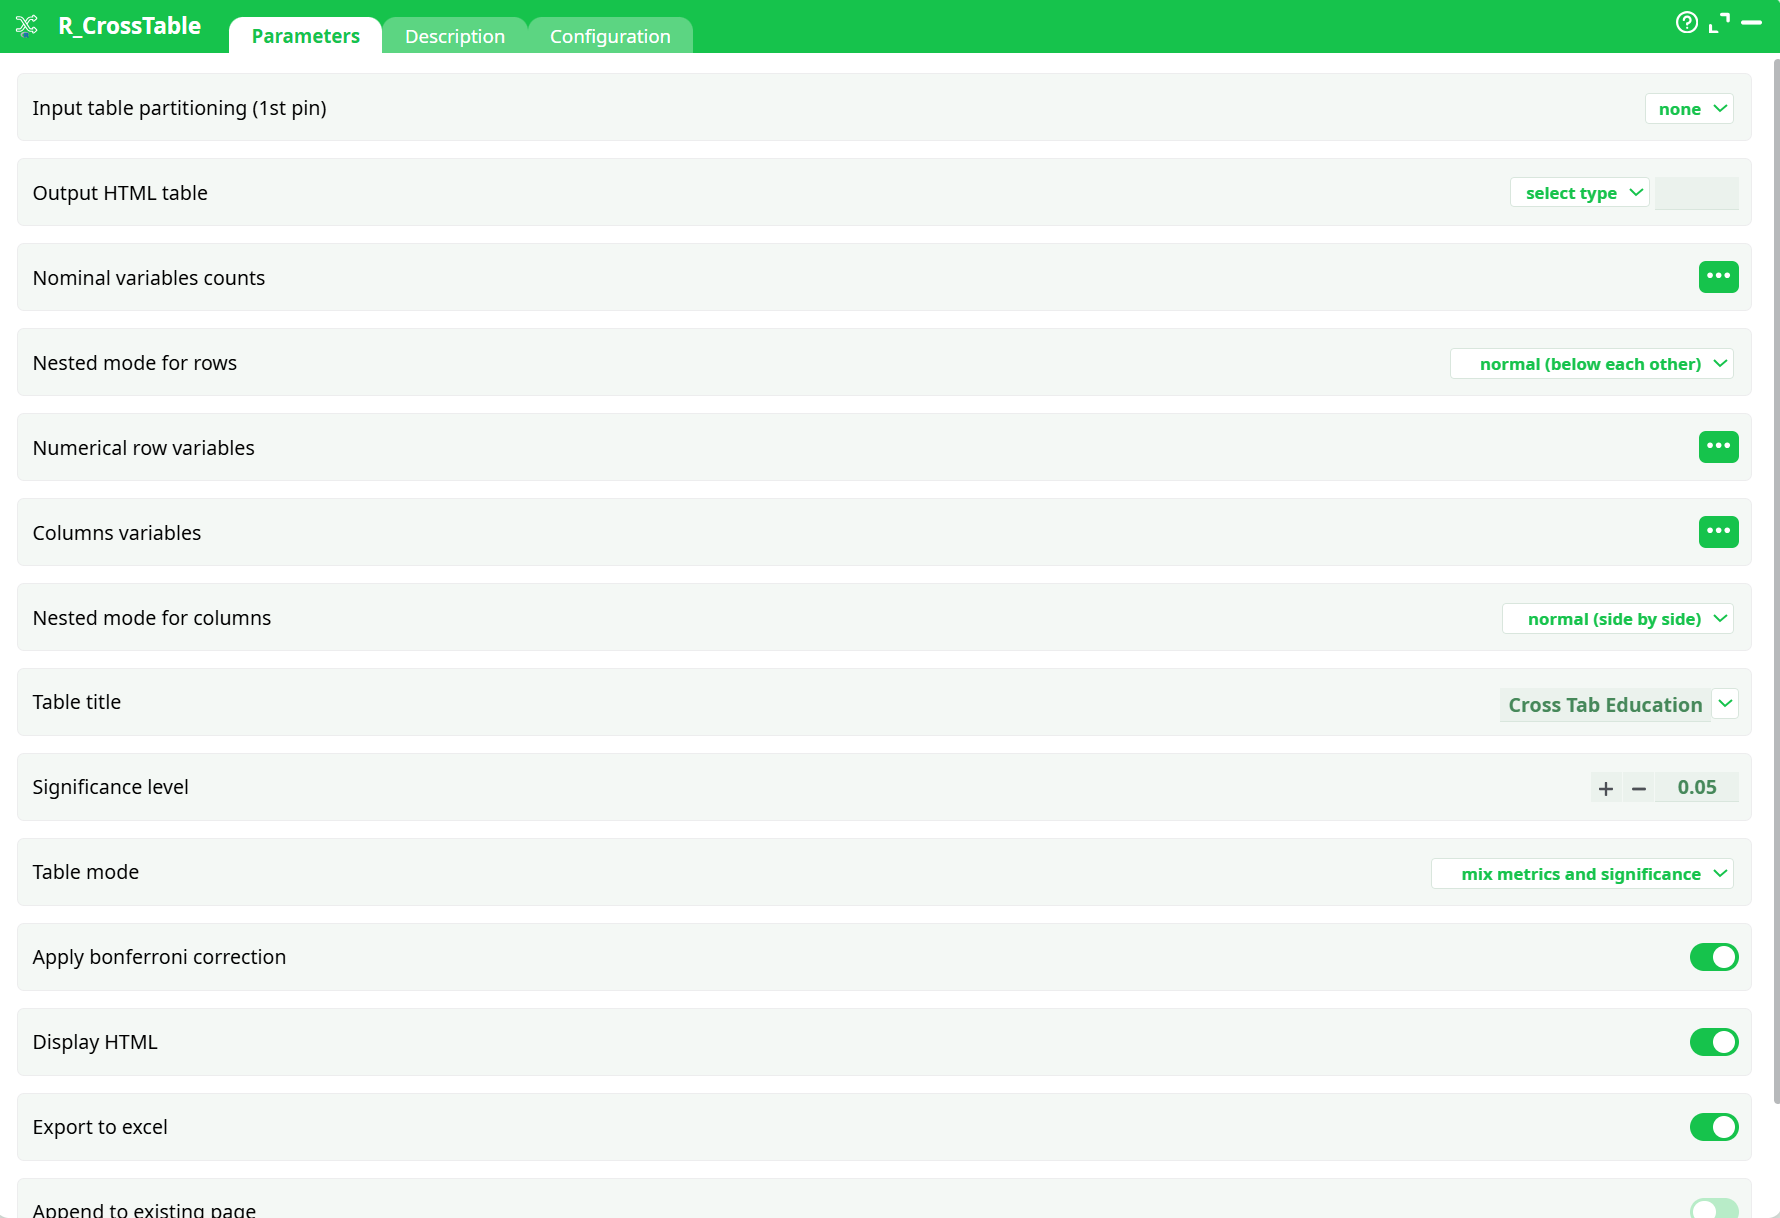
Parameters:
- Output HTML table
- Nominal variables counts
- Nested mode for rows
- Numerical row variables
- Columns variables
- Nested mode for columns
- Table title
- Significance level
- Table mode
- Apply bonferroni correction
- Display HTML
- Export to excel
- Append to existing page
- Table width
¶ Description tab
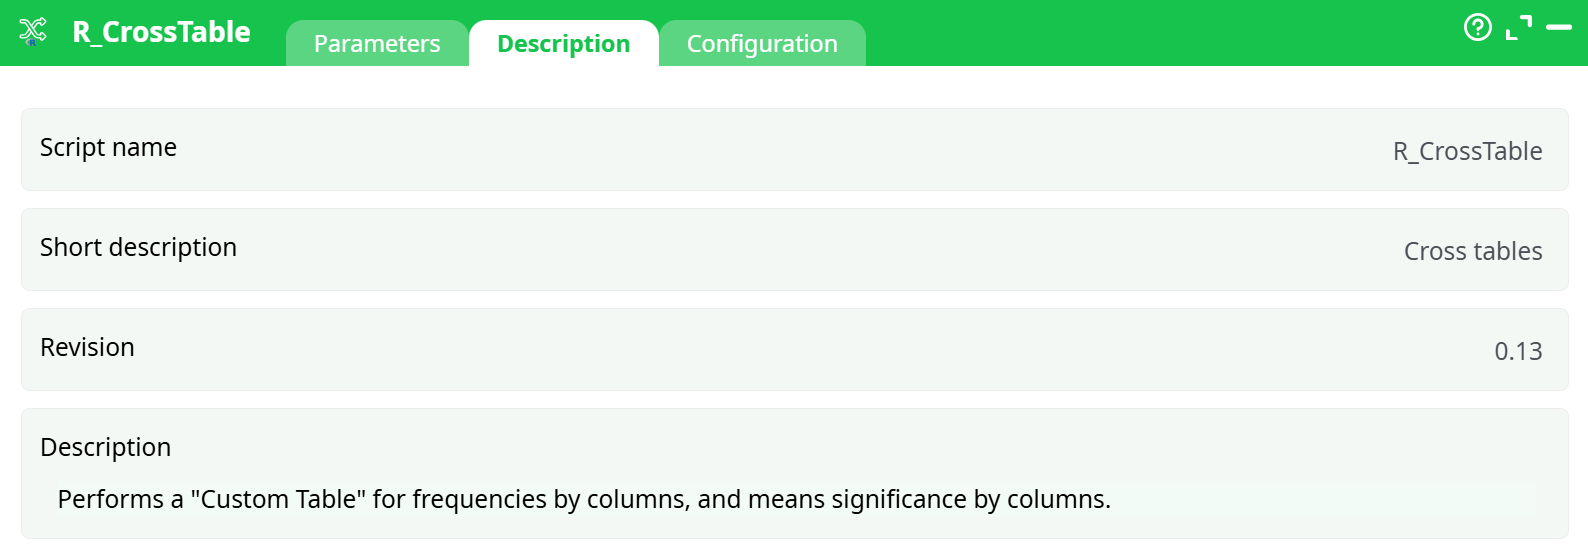
Parameters:
- Script name
- Short description
- Revision
- Decription
¶ Configuration tab
See dedicated page for more information.
¶ About
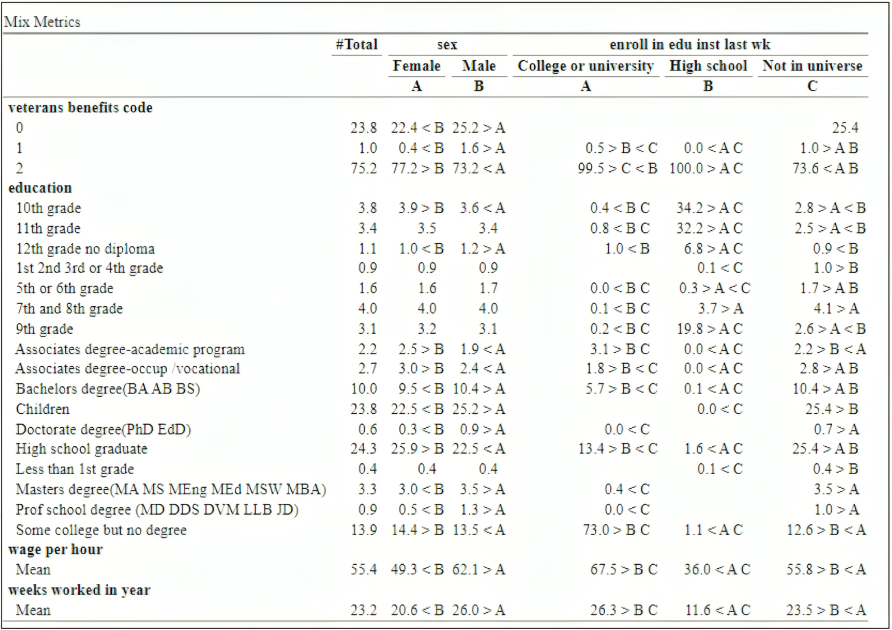
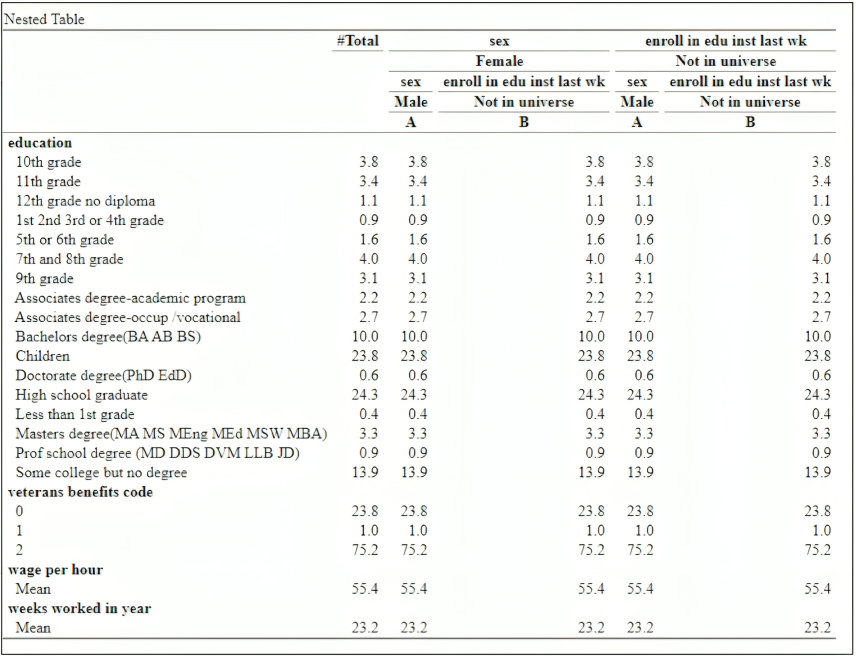
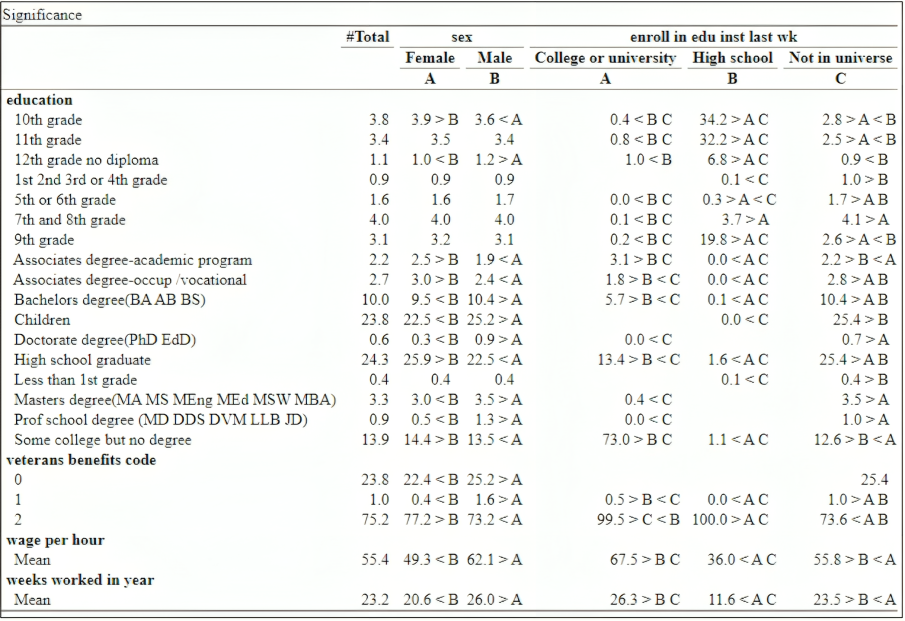
Use this node to generate a table as the following, in which you can control easily which variables are nested:
The output can be any combination of
- An ETL table
- An HTML Table
- An Excel file
Parameters:
- Output HTML Table: set name of the html file containing the table (can be existing, with the Append option)
- Nominal Row Variable : select the nominal vbariables to compare
- Nested Mode for Rows: select if you want to set dependencies between your nominal variables
- Numerical Row Variables: select the variables on which you wish to compare means
- Column Variables: select the variables on which you wish to perform the “Group By”
- Nested mode for Columns:
- Table Title: name of the table in the HTML file, and the TAB in the Excel file
- Significance LeveL default is 0.05
- Table Mode:
- Mix Metrics and Significance: generates a single table in which the significance is marked next to the numeric metric
- Separate Significance: generate two tables, one with only the metric, and one combined
- No Significance: only show the metric
- Apply Bonferroni Correction: self explanatory
- Display HTML: display the HTML file on completion
- Export to Excel: Export table to an excel file, in the same directory as the HTML File
- Append to existing file: add the table to the current HTML File, and the Excel as a new Tab
Examples: