¶ Description
Greenleaf's Yaysaying control.
¶ Parameters
¶ Parameters tab
Parameters:
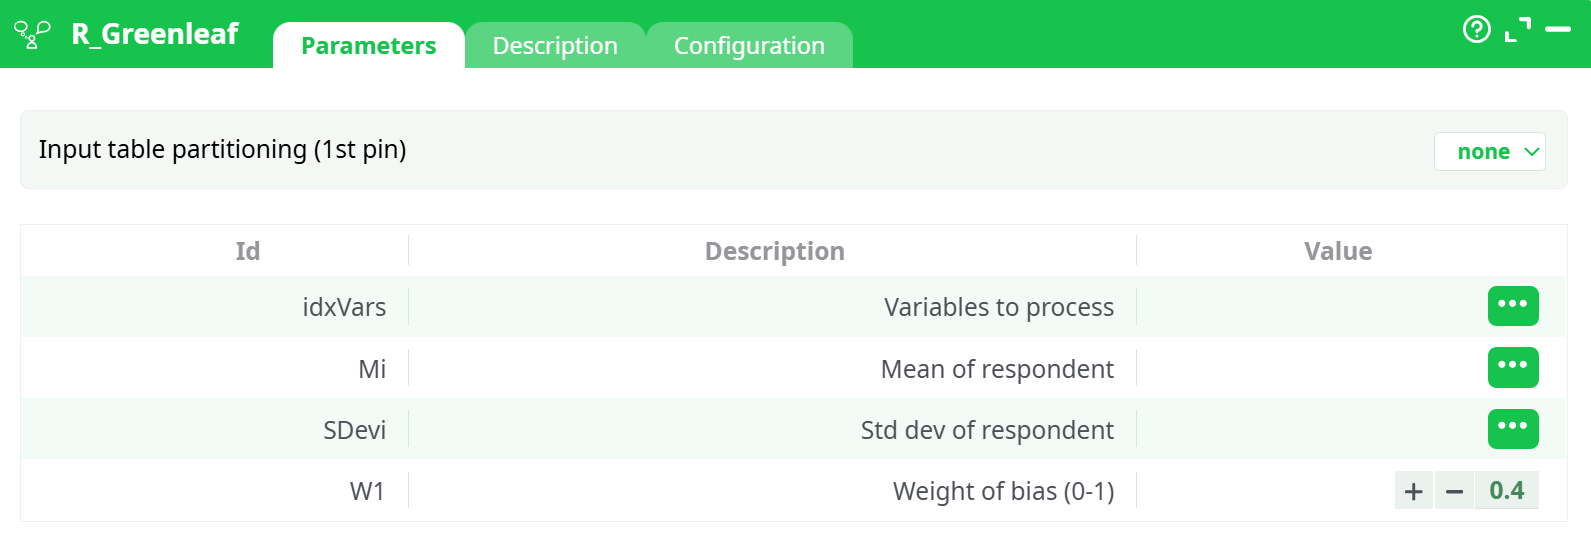
- Input table partitioning (1st pin)
- Variables to process
- Mean of respondent
- Std dev of respondent
- Weight of bias (0-1)
¶ Description tab
Parameters:
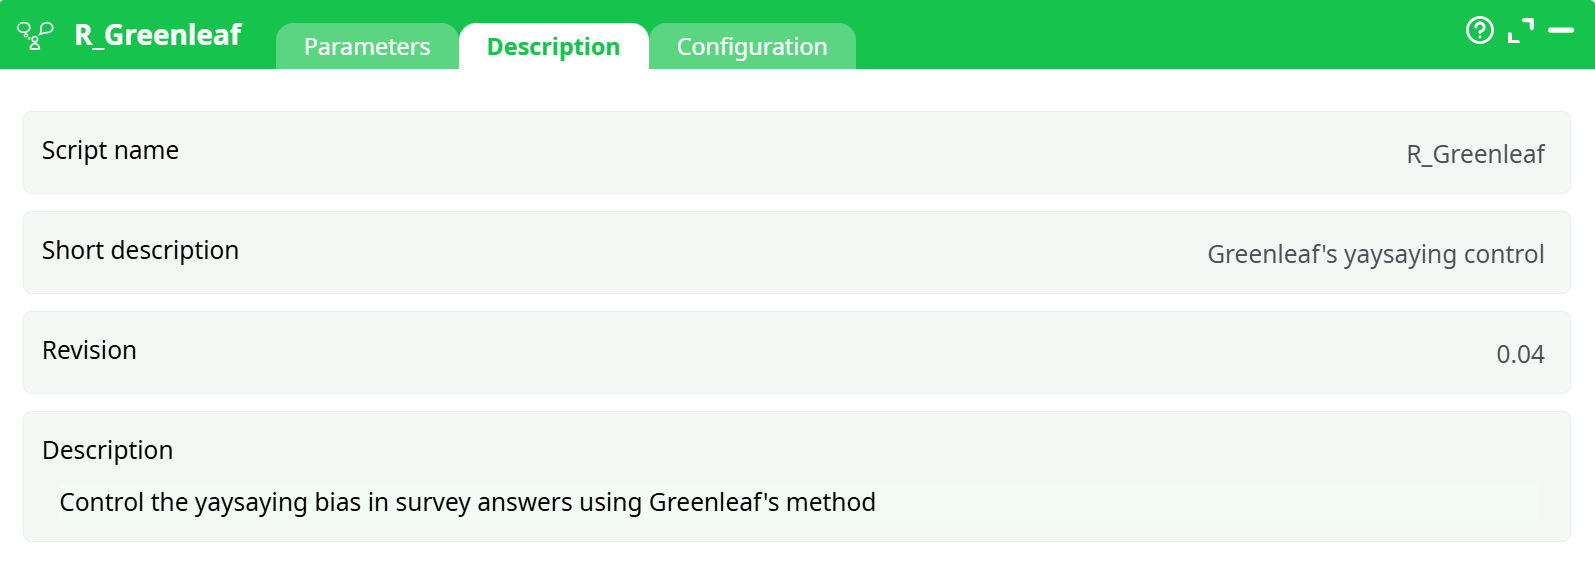
- Script name
- Short description
- Revision
- Description
¶ Configuration tab
See dedicated page for more information.
¶ About
R_Greenleaf applies Greenleaf’s method to reduce systematic agreement bias in questionnaire responses.
Given each respondent’s mean (Mean of respondent) and standard deviation (Std dev of respondent) across a set of items, the action outputs adjusted scores (GL_<item>) for the chosen item columns. The strength of the correction is controlled by Weight of bias (0-1) (0–1).
Control acquiescence (“yaysaying”) bias in Likert-style survey data by adjusting each respondent’s item scores using their personal mean and dispersion. Produces bias-corrected scores for a selected set of items.
¶ Input
¶ Required table (1 row = 1 respondent)
- One numeric column per item to correct (e.g.,
Q1,Q2,Q3) — all on the same Likert scale (e.g., 1–5). Mean of respondent— respondent’s mean across the selected items.Std dev of respondent— respondent’s sample standard deviation across the selected items.
Accepted formats: CSV, table from upstream action. All selected columns must be numeric.
Minimal example (CSV):
Mi,SDevi,Q1,Q2,Q3
4.000,1.000,5,4,3
3.333,0.577,4,3,3
2.667,1.155,2,2,4
4.000,1.000,3,4,5
1.333,0.577,1,2,1
Tip: If your source file contains only item columns, compute
Mean of respondentandStd dev of respondentrow-wise first (e.g., with a “Row Stats/Row Aggregates” action).
¶ Output
- For every selected item column, the action emits a bias-corrected column named
GL_<item>(e.g.,GL_Q1,GL_Q2,GL_Q3) on the original scale. - The original columns are kept unless you remove them downstream.
Example (first 5 rows):
Mi        SDevi      Q1  Q2  Q3   GL_Q1   GL_Q2   GL_Q3
4.000     1.000       5   4   3    4.76     4       3
3.333     0.577       4   3   3    3.90     3       3
2.667     1.155       2   2   4    1.80    1.80     3.80
4.000     1.000       3   4   5    3.00     4       4.76
1.333     0.577       1   2   1    0.60     2.20     0.60
Interpretation:
GL_*values are the item scores with acquiescence bias reduced using each respondent’sMean of respondentandSDevi. Higher Weight of bias (0-1) → stronger correction; Weight of bias (0-1) = 0 → no change.
¶ How to Run
-
Prepare input data
Ensure you have columnsMi,SDevi, and the item columns to correct (Q1..Qk). All must be numeric. -
(If reading CSV) Import data
readCSV: delimiter,, decimal.- If your platform does not enforce types, insert ChangeDataType and cast
Mi,SDevi,Q1..Qkto Float/Double.
-
Open R_Greenleaf → Parameters
Variables to process→ selectQ1, Q2, Q3(or your item set)Mean of respondent→MiStd dev of respondent dev of respondentvi→SDeviWeight of bias (0-1)→0.4(adjust as desired)- Input table partitioning (1st pin) →
none
-
Run
Inspect the Data tab of the action’s output for new columnsGL_Q1..GL_Qk.
Optionally add writeCSV to export results.
¶ Example Pipeline
readCSV → ChangeDataType (cast Mi,SDevi,Q1..Qk to float) → R_Greenleaf → writeCSV
¶ Screenshot Placeholders
-
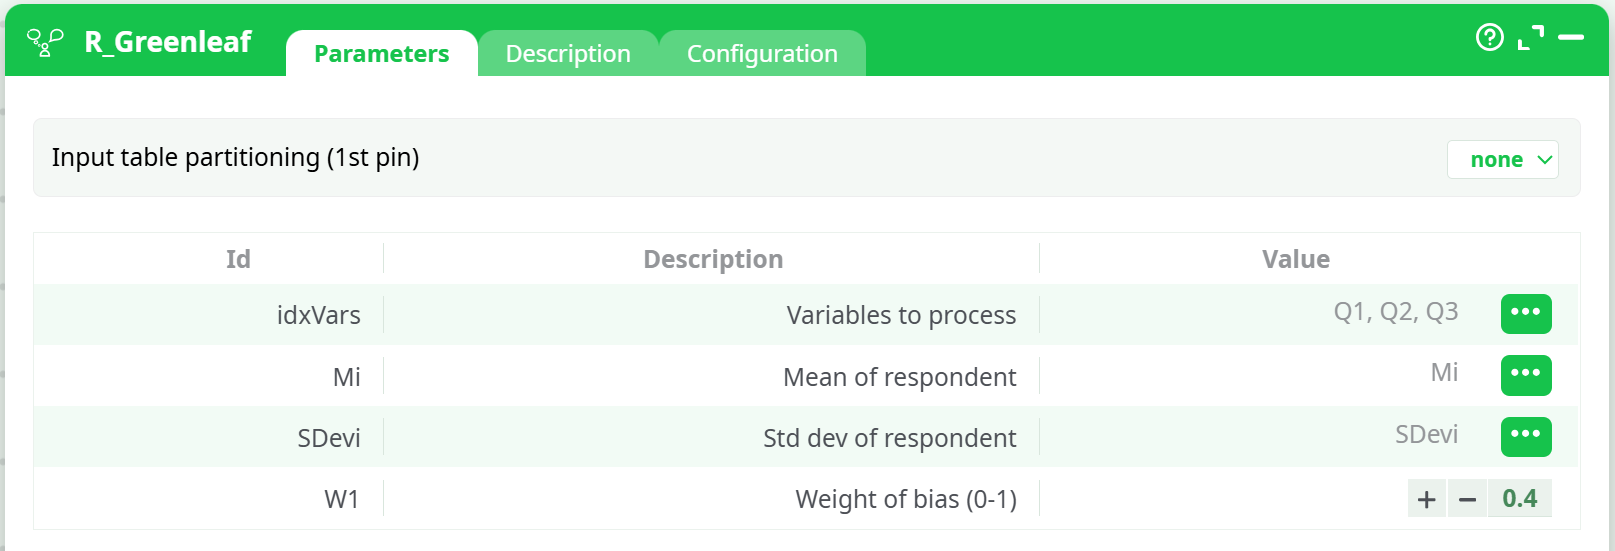
ShowsVariables to process=Q1,Q2,Q3,Mean of respondent=Mi,Std dev of respondent=SDevi,Weight of bias (0-1)=0.4, and partitioning=none. -
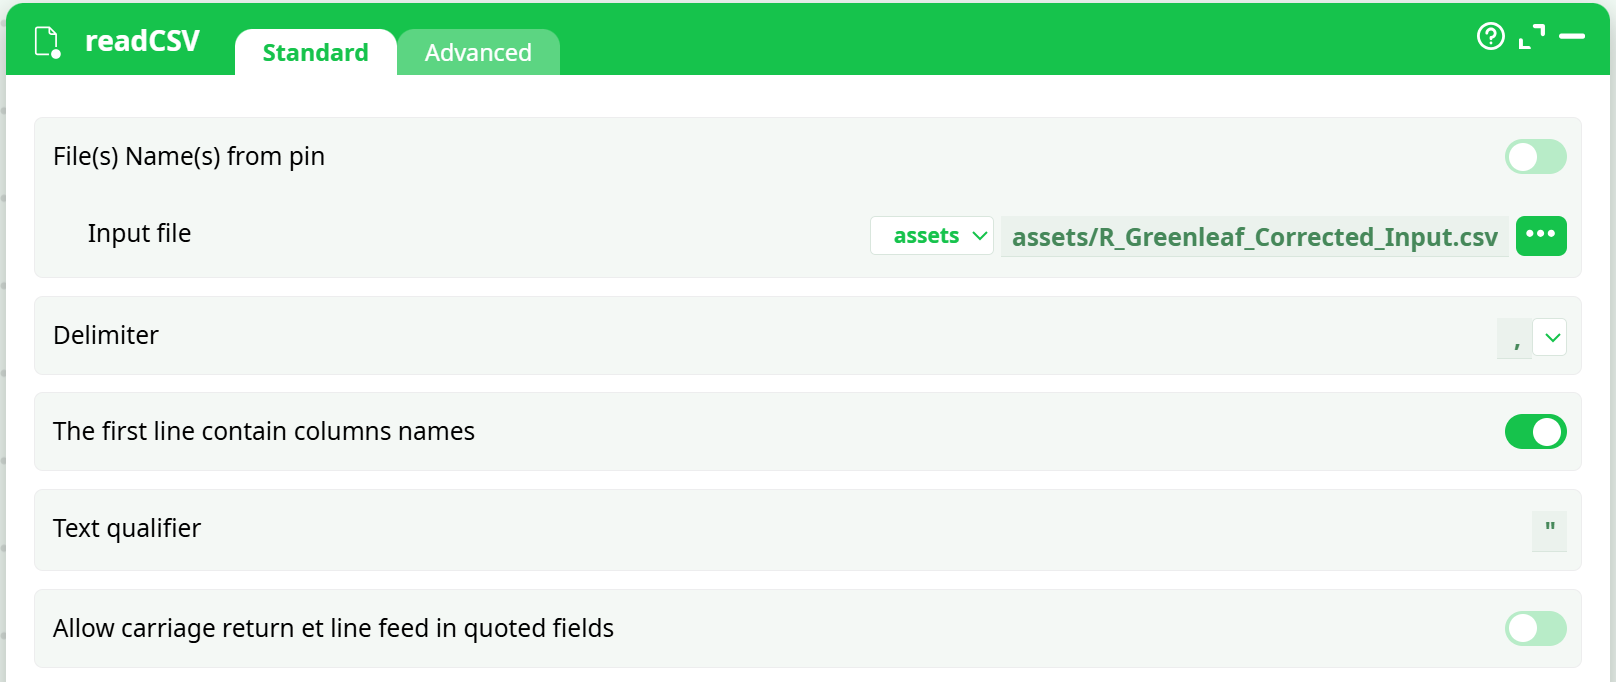
Demonstrates delimiter,, decimal., header row ON. -
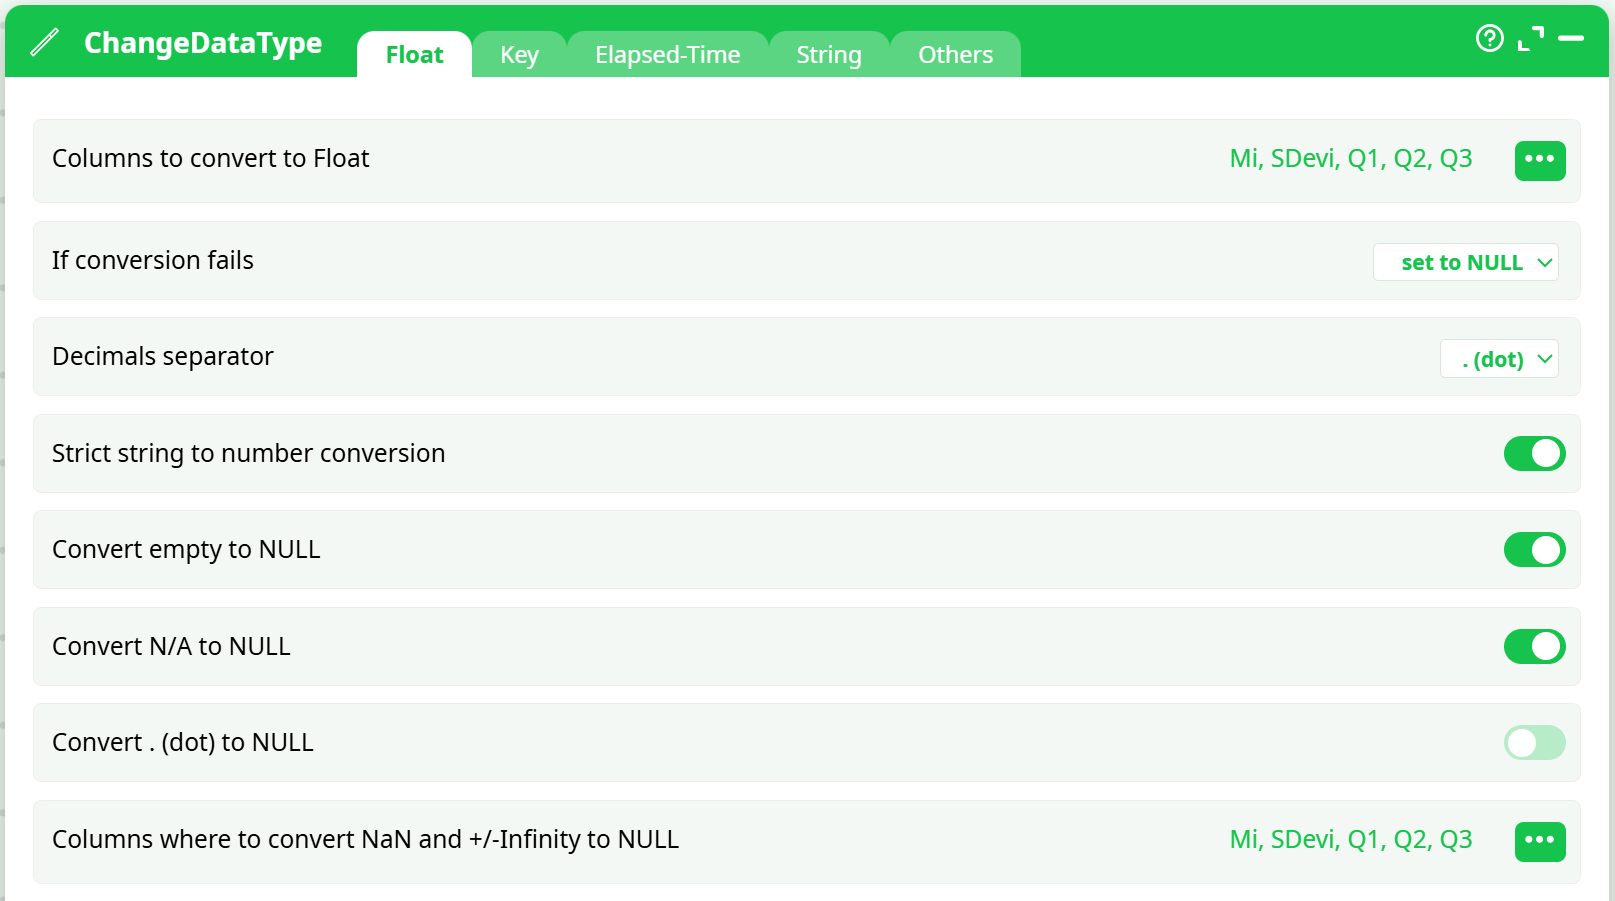
Illustrates casting ofMi,SDevi,Q1,Q2,Q3to Float; strict conversion ON. -
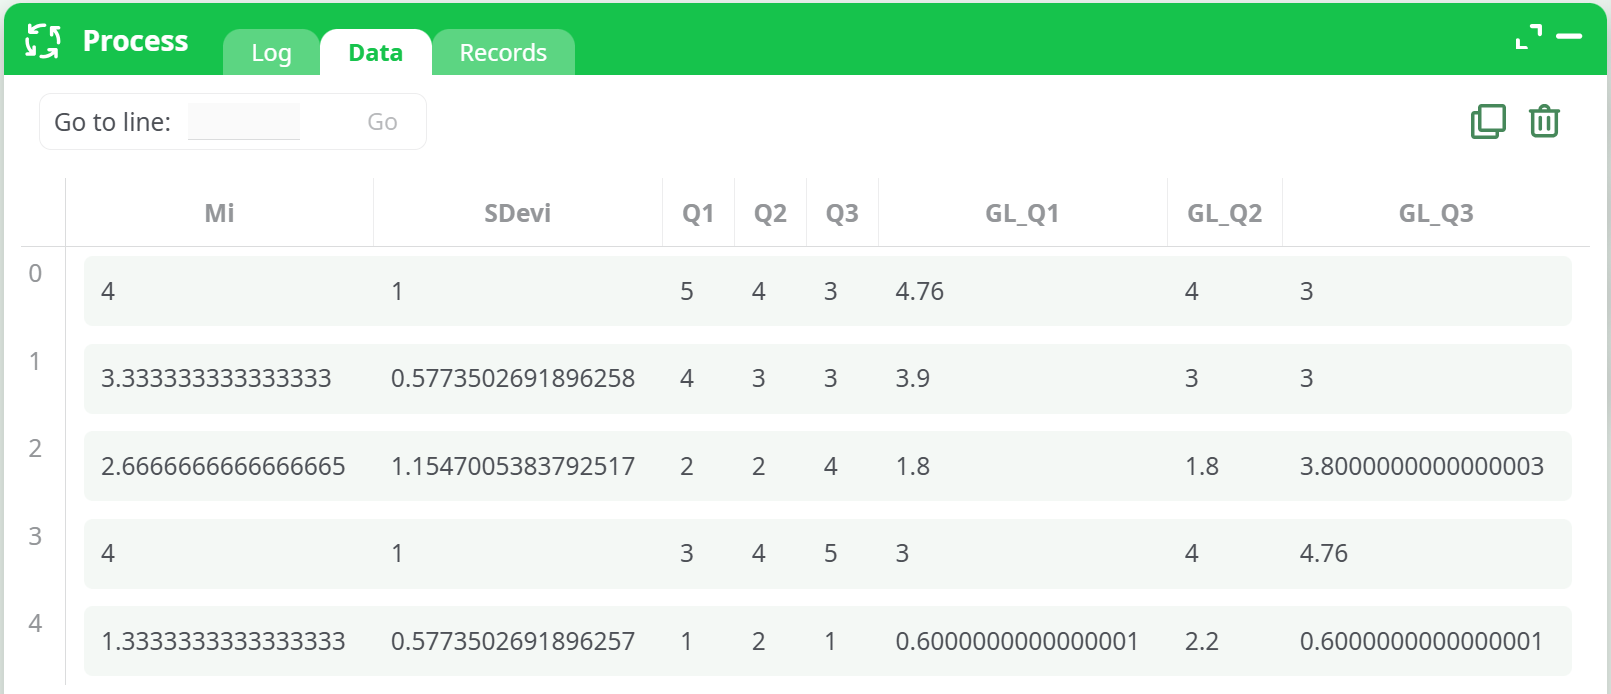
Displays resulting table includingGL_Q1,GL_Q2,GL_Q3. -
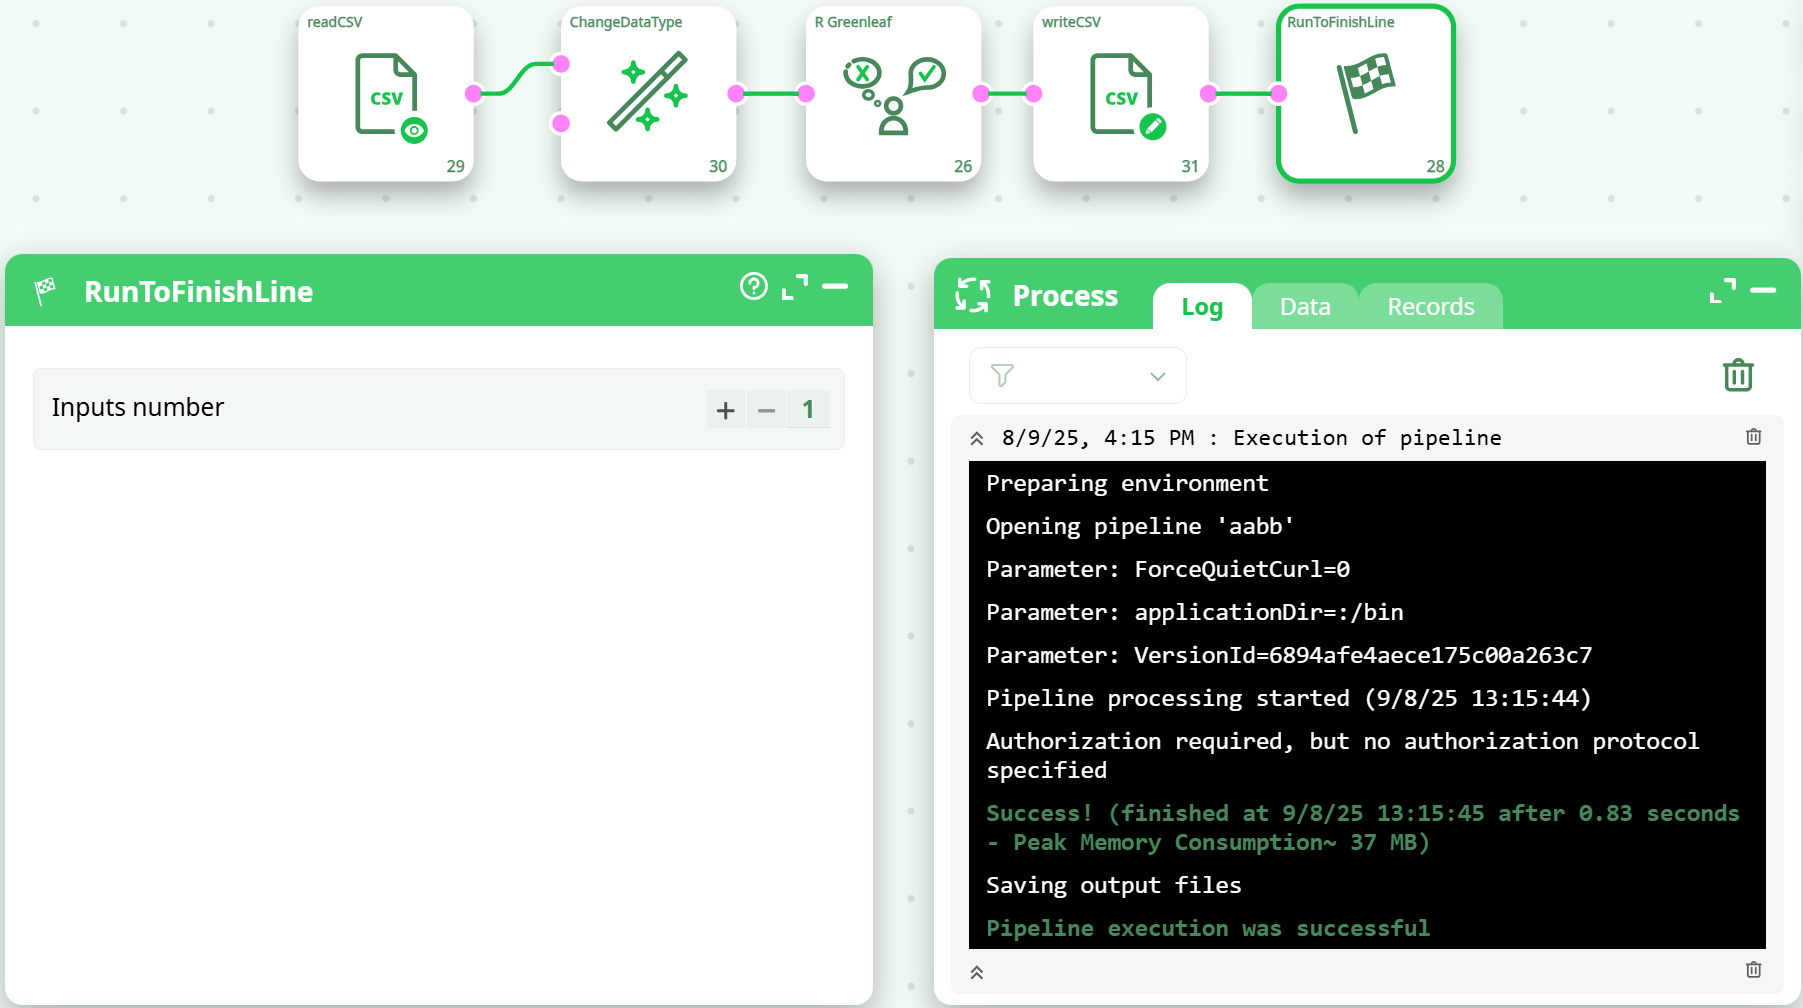
Confirms successful execution and file save.
¶ Notes & Best Practices
- All item columns must be numeric. If you see
non-numeric argument to binary operator, cast types before R_Greenleaf. - Same scale across items. Don’t mix 1–5 with 1–7 items.
- Missing values: If present, consider imputing or let them flow as
NULL; downstream stats should account for them. - Sensitivity (Weight of bias (0-1)): Start at
0.3–0.5. Increase only if diagnostics indicate strong acquiescence bias. - Reproducibility: Save the exact item list used in
Variables to processand the chosenWeight of bias (0-1).
¶ Appendix — Quick Validation Checklist
-
Mean of respondent= row-mean across the selected items -
Std dev of respondent= row sample SD across the selected items -
Variables to processincludes only numeric item columns -
Weight of bias (0-1)between 0 and 1 - Output contains
GL_<item>columns on the same scale as inputs