¶ Description
K-Medoids Clustering.
¶ Parameters
¶ Parameters tab
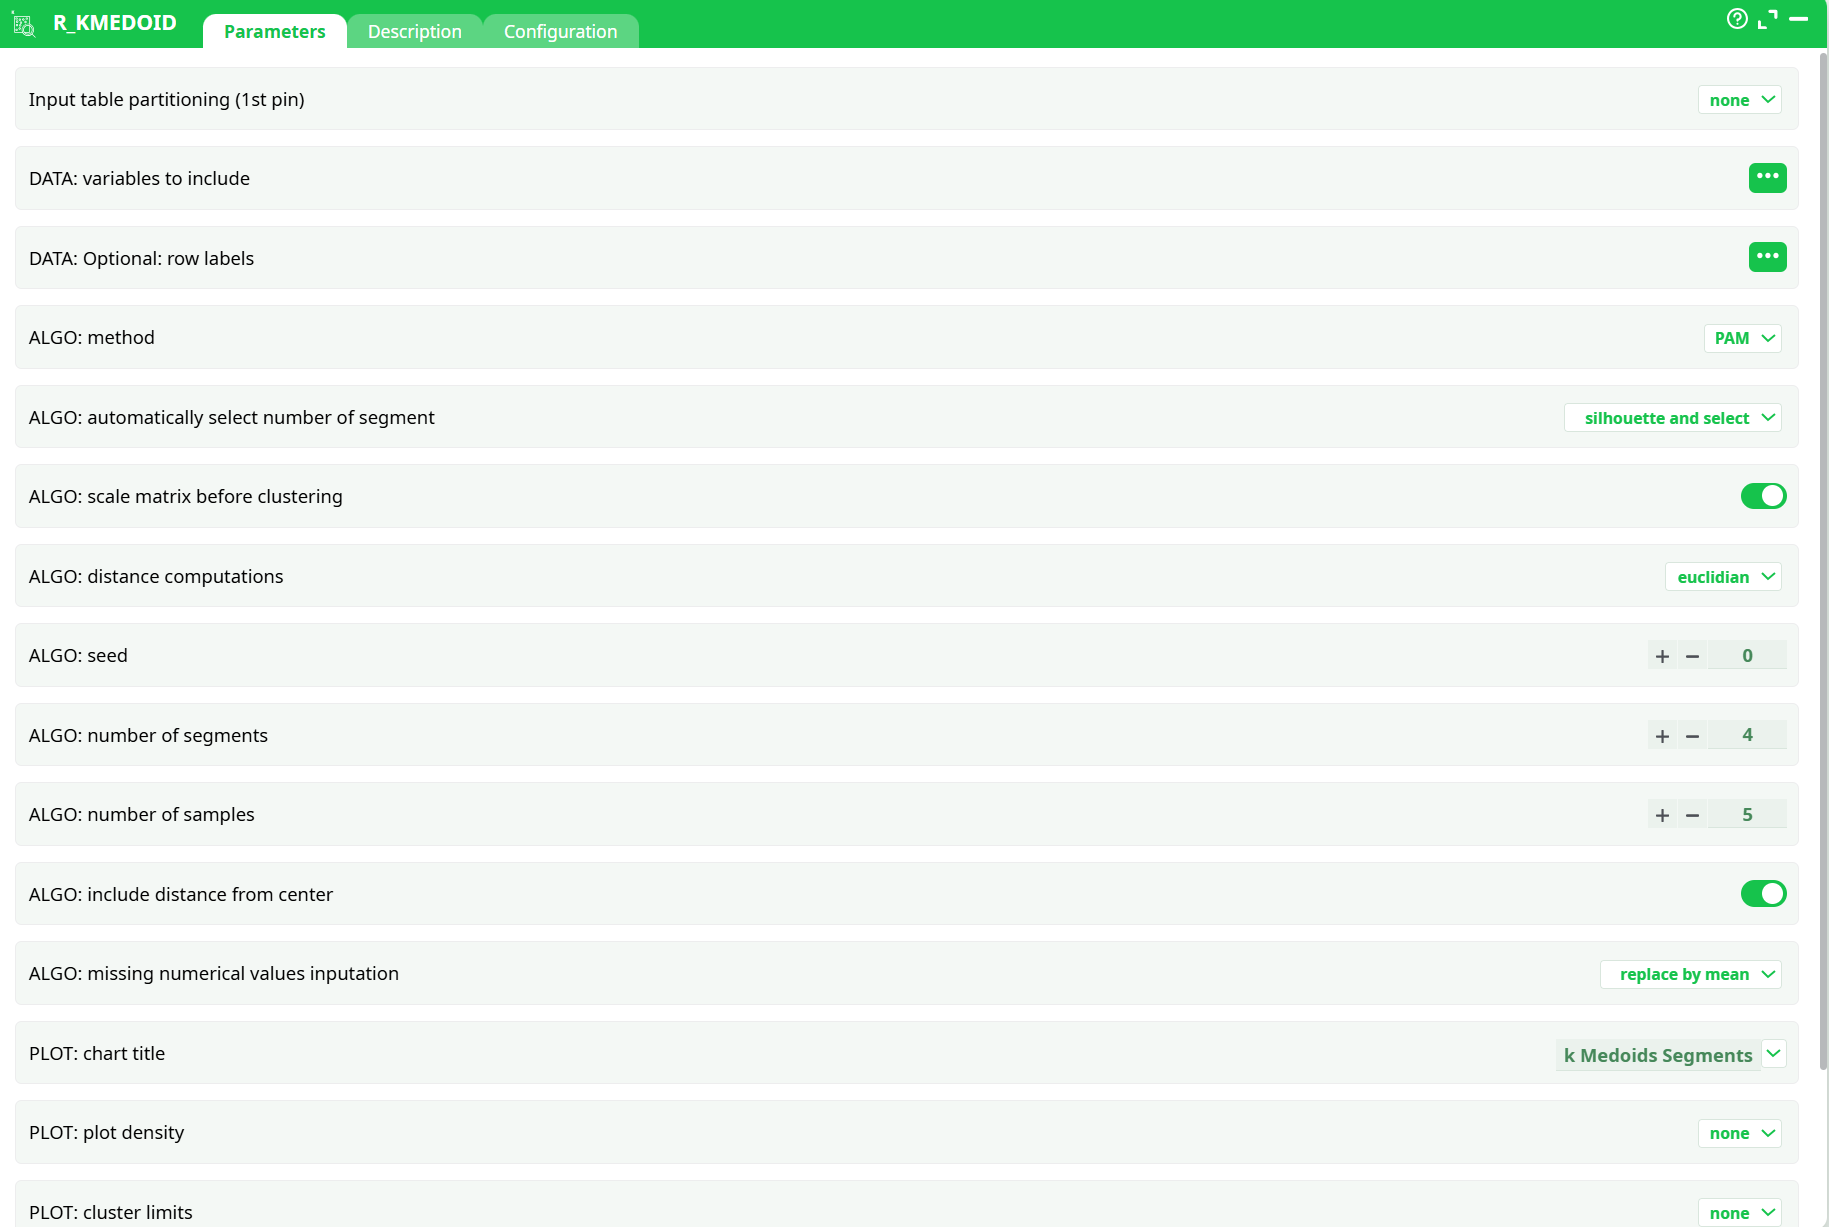
Parameters:
- Input table partitioning (1st pin)
- Data: variables to include
- Data: optional row labels
- Algo: method
- Algo: automatically select number of segment
- Algo: scale matrix before clustering?
- Algo: distance computations
- Algo: seed
- Algo: number of segments
- Algo: number of samples
- Algo: include distance from center
- ALGO: missing numerical values inputation
- Plot: chart title
- Plot: plot density
- Plot: cluster limits
- OUT: plot results
- OUT: output type
¶ Description tab
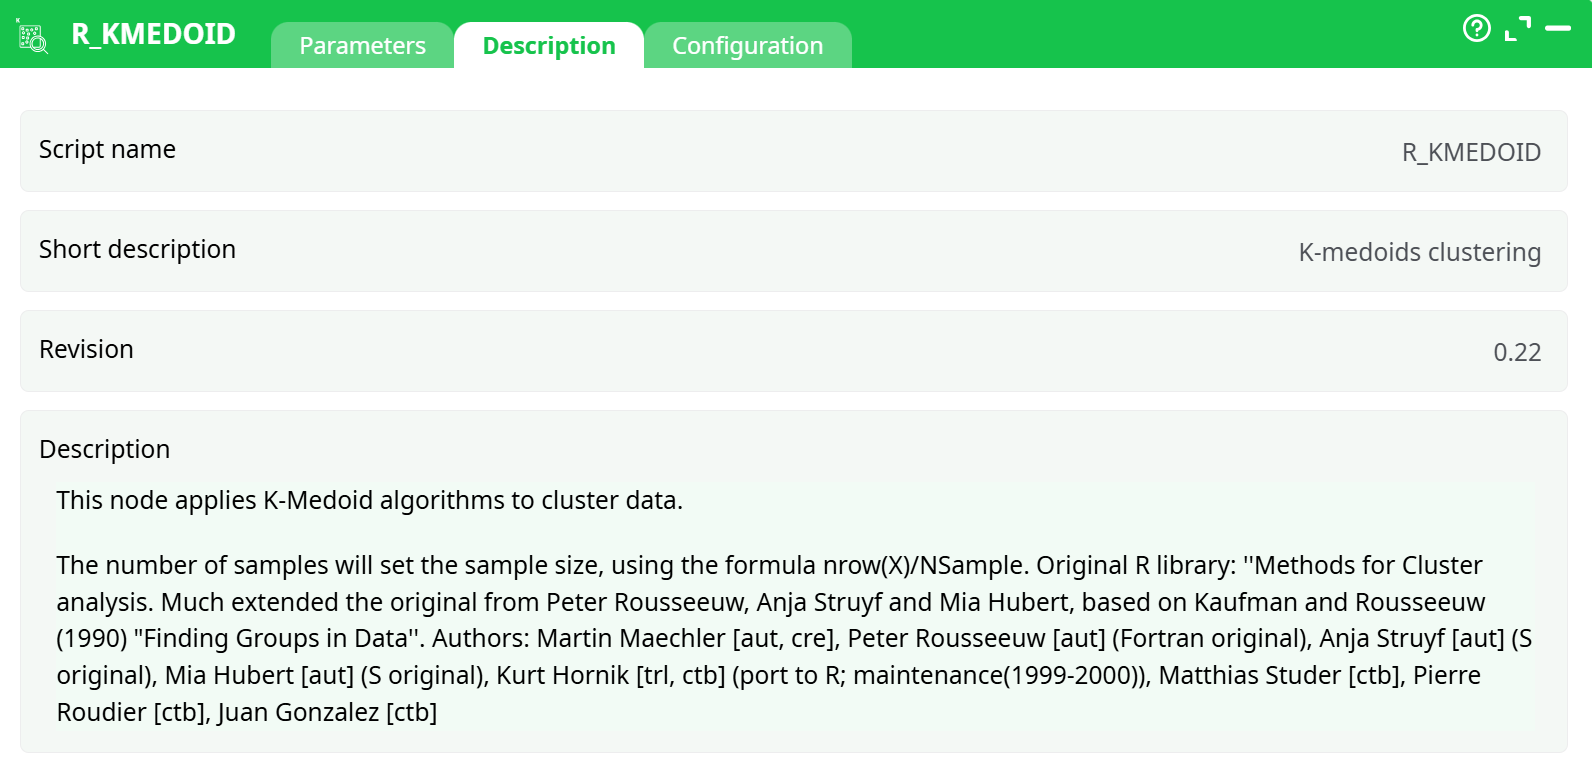
Parameters:
- Script name
- Short description
- Revision
- Decription
¶ Configuration tab
See dedicated page for more information.
¶ About
This action is mainly for explanatory/teaching purposes. If you want to create a better segmentation, you should use Stardust.
K-Medoid is an alternate clustering technique that performs better than K-Means with non-spherical segments. It is, however, quite slow and impossible to apply to large dataset without sampling. K-Medoid will output a new column with the cluster number, and columns with the distance between each point and the center of each segment. You can easily transform this information into probability.
Parameters:
- Method: you can use either PAM or CLARA
- ALGO: automatically select number of segments: use the silhouette method, defined as follows: “Put a(i)= average dissimilarity between I and all other points of the cluster to which I belong. (if i is the only observation in its cluster, s(i)=0 without further calculations). For all other clusters C, put d(i,C) = average dissimilarity of i to all observations of C. The smallest of these d(i,C) is b(i)=minCd(i,C), and can be seen as the dissimilarity between i and its “neighbor” cluster, i.e., the nearest one to which it does not belong. Finally,
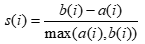
Observations with a large s(i) (almost 1) are very well clustered, a small s(i) (around 0) means that the observation lies between two clusters, and observations with a negative s(i) are probably placed in the wrong cluster.” - Scale Matrix before clustering: proceed with a normalization of the data to avoid dominance from varaibles on a larger scale.
- Distance computation: Select whether you want to use Euclidean (sensitive to outliers) or Manhattan (absolute) distance.
- Seed: set a seed number so you can run the same analysis again, with consistent results.
- Number of segments: Select the number of segments to keep.
- Number of samples: sumber of samples to use in the process. 1 means all the dataset will be used (may be very slow)
- Cluster Name: name of the variable with the cluster results.
- Include distance from center: include Euclidean distance from centers as new variables.
- Plot Results: Select whether or not to display a distribution chart
- Chart title: set the title of the chart (if you selected the previous option)
- Model Name: Name of the model to use for later scoring.