¶ Description
Create a ROC curve after applying a model.
¶ Parameters
¶ Parameters tab
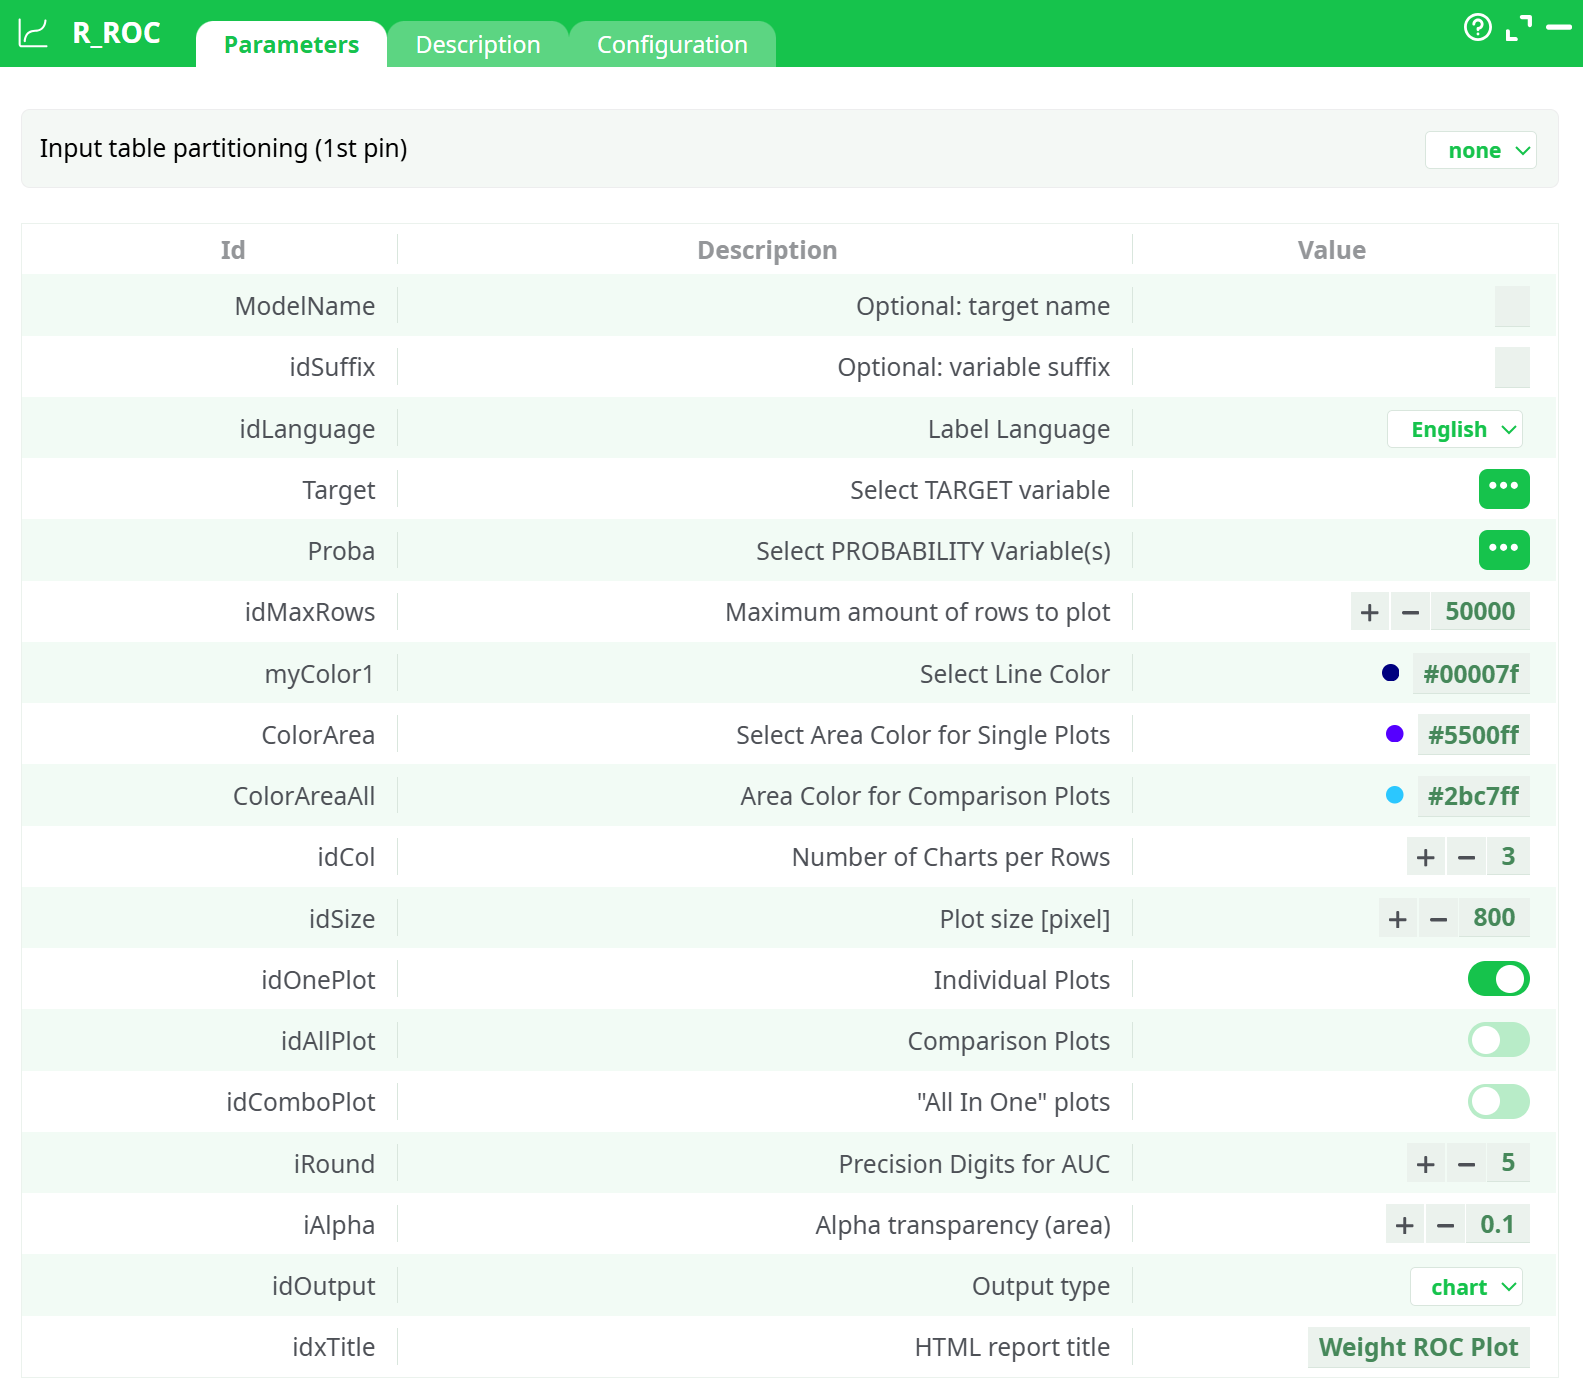
Parameters:
- Input table partitioning (1st pin)
- (Optional) Target Name
- (Optional) Variable Suffix
- Label Language
- Select TARGET variable
- Select PROBABILITY Variable(s)
- Maximum amount of rows to plot
- Select Line Color
- Select Area Color for Single Plots
- Area Color for Comparison Plots
- Number of Charts per Rows
- Plot size [pixel]
- Individual Plots
- Comparison Plots
- "All In One" plots
- Precision Digits for AUC
- Alpha transparency (area)
- Output type
- HTML report title
¶ Description tab
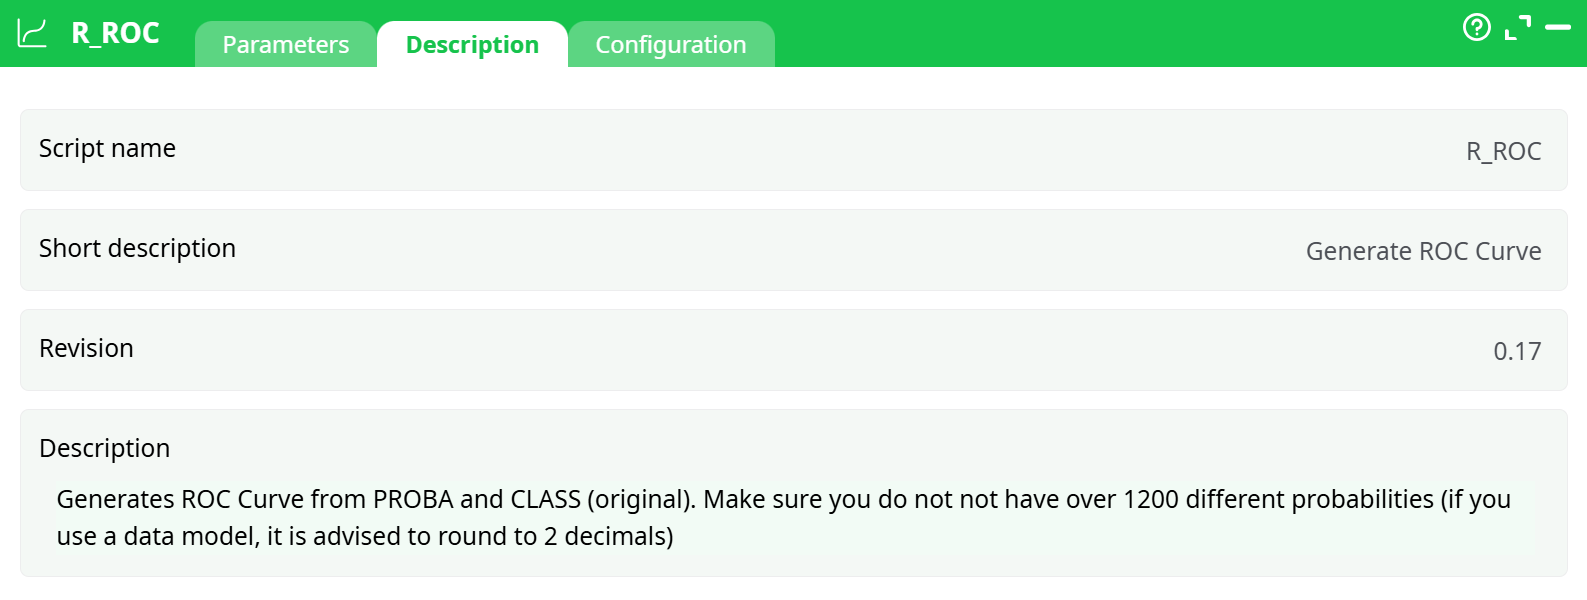
Parameters:
- Script name
- Short description
- Revision
- Decription
¶ Configuration tab
See dedicated page for more information.
¶ About
The R_ROC action button generates a Receiver Operating Characteristic (ROC) Curve based on predicted probabilities and binary classification targets. This tool evaluates model performance by plotting the True Positive Rate (TPR) against the False Positive Rate (FPR) for different probability thresholds. The Area Under the Curve (AUC) metric quantifies the model's classification ability.
¶ Input
-
Format:
.csvtable -
Required Columns:
Target: Binary values (0 or 1), representing the true classProba: Predicted probability values from the model (between 0 and 1)
-
Minimum data requirement: At least 100 rows for stable and meaningful ROC curve generation. While it technically works with fewer rows, results may be misleading (e.g., AUC = 1 with diagonal curve).
-
Example Input Table:
| Target | Proba |
|---|---|
| 1 | 0.95 |
| 0 | 0.10 |
| 1 | 0.88 |
| ... | ... |
¶ Output
-
Image file: ROC curve (
ROC_Proba.png) -
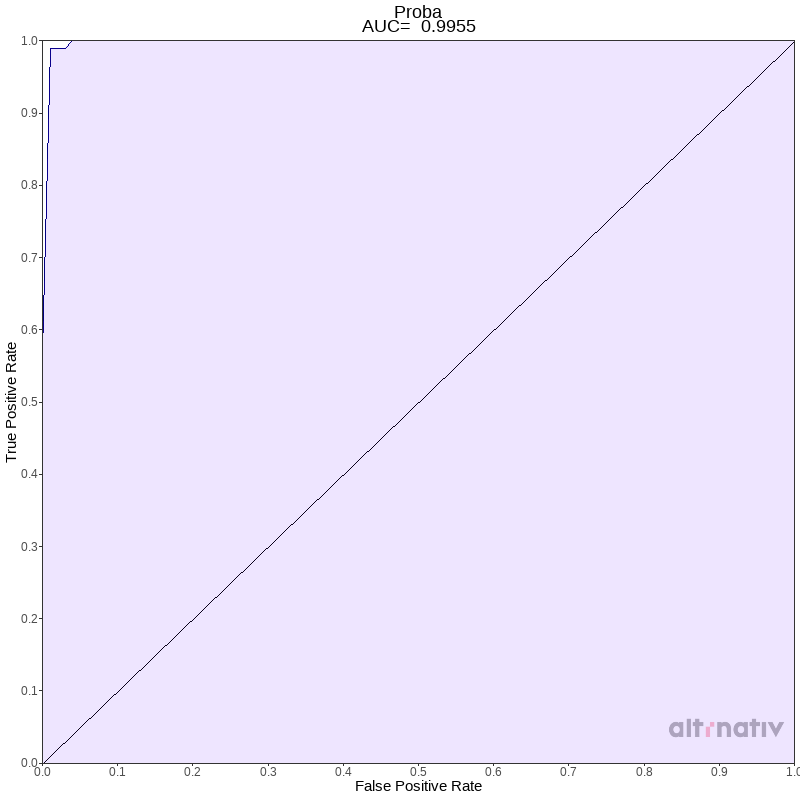
Content:
- ROC curve (TPR vs FPR)
- AUC score displayed on the plot
-
Example ROC Output:
¶ Use Cases
- Evaluate binary classifier models such as logistic regression, random forest, XGBoost, etc.
- Compare classifier performance by AUC metric
- Visualize model discrimination capability at different thresholds
¶ Common Pitfalls & Troubleshooting
¶ ❌ AUC = 1 with diagonal ROC curve
- Cause: Too few rows or repeated identical values in
Select PROBABILITY Variable(s) - Fix: Use at least 100+ rows with varied probability values
¶ ❌ AUC = 0.5 or meaningless results
- Cause: Target column is constant or incorrectly formatted
- Fix: Ensure
Select TARGET variablecontains both 0 and 1 classes
¶ ❌ "Too many probability levels" error
- Cause: Excessive unique values in
Probacolumn - Fix: Limit
Select PROBABILITY Variable(s)to fewer than 1200 unique values. Round to 2–4 decimals if needed.
¶ How to Run
- Prepare input CSV with
Select TARGET variableandProbacolumns. - Configure parameters (optional: set language, color, plot style).
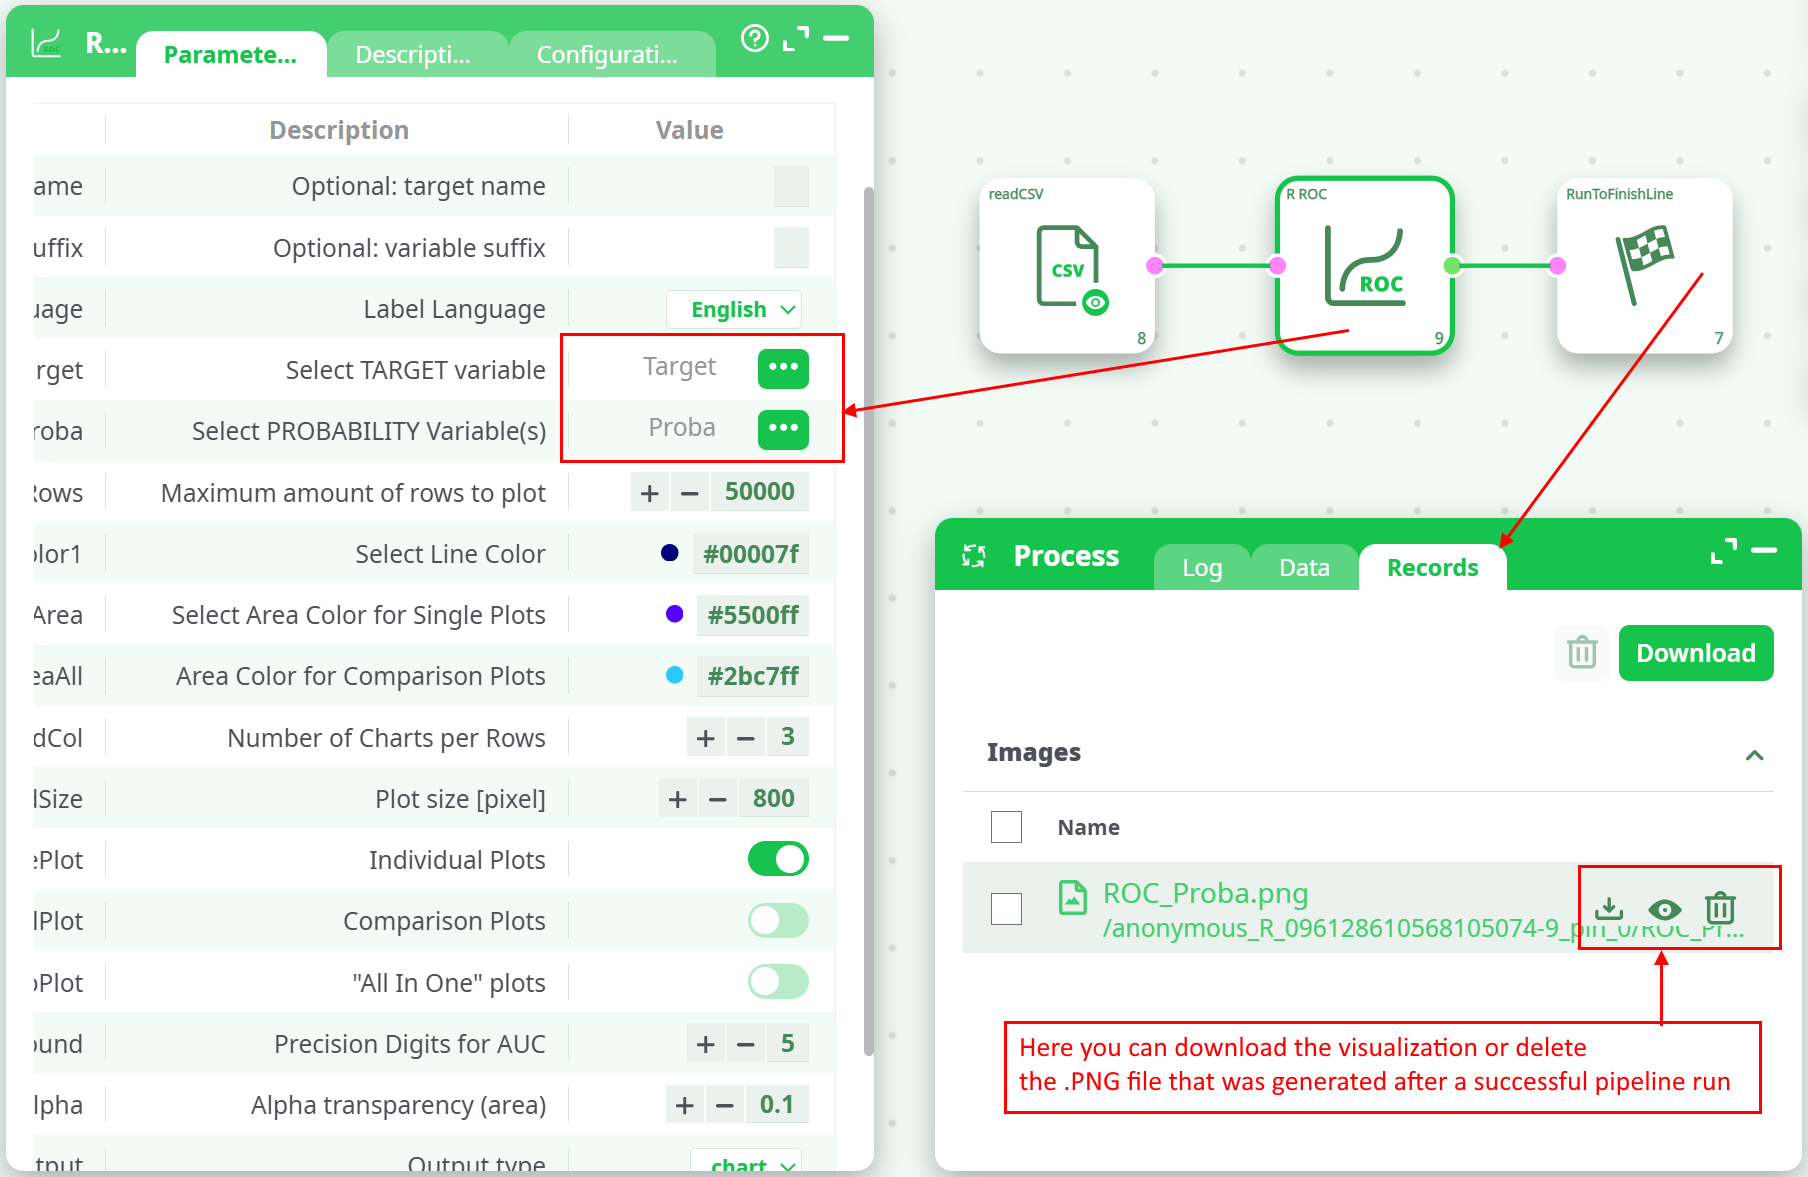
- Run pipeline and retrieve output
.pngfile from the log or records tab.
¶ Sample Pipeline