¶ Decription
Create a waterfall Plot.
¶ Parameters
¶ Parameters tab
Parameters:
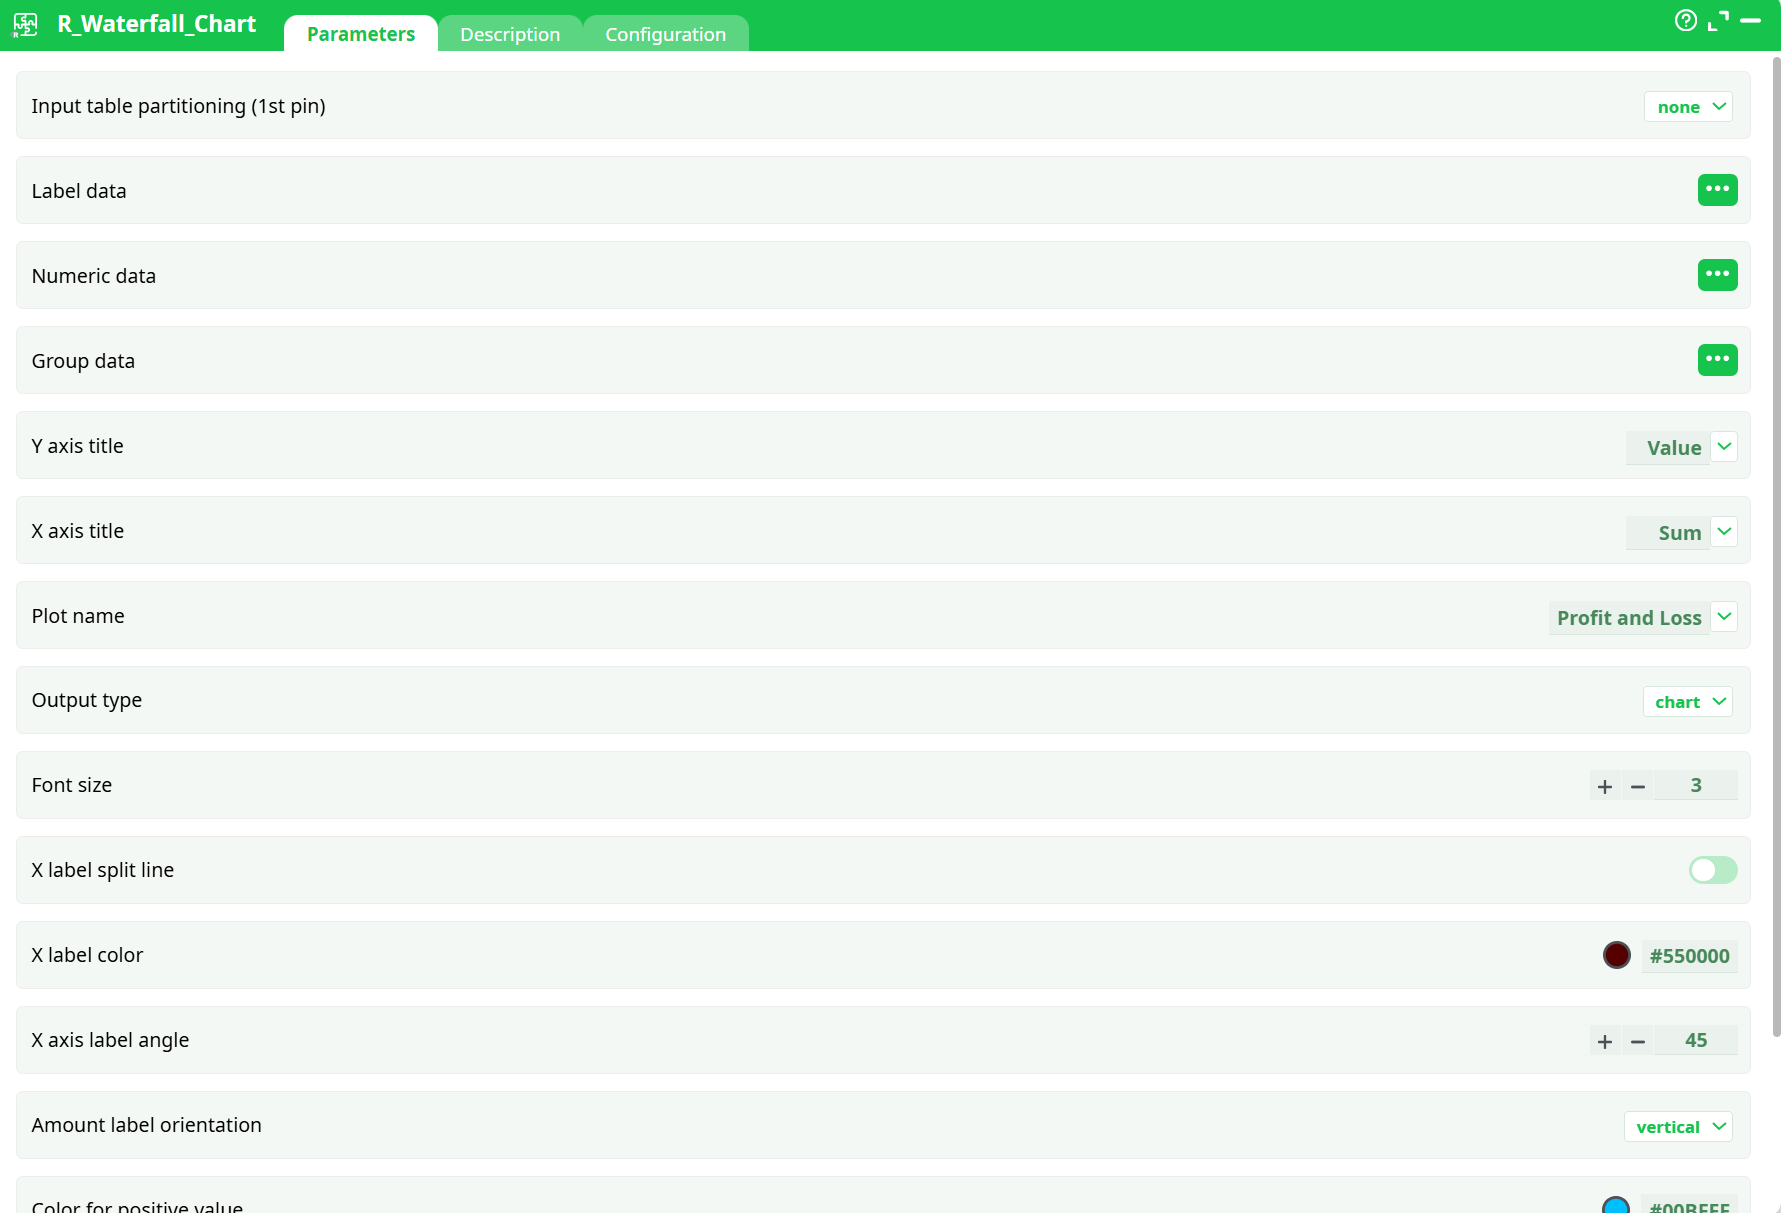
- Input table partitioning (1st pin)
- Label data
- Numeric data
- Group data
- Y axis title
- X axis title
- Plot name
- Output type
- Font size
- X label split line
- X label color
- X axis label angle
- Amount label orientation
- Color for positive value
- Color for negative values
- Add sub-totals
¶ Description tab
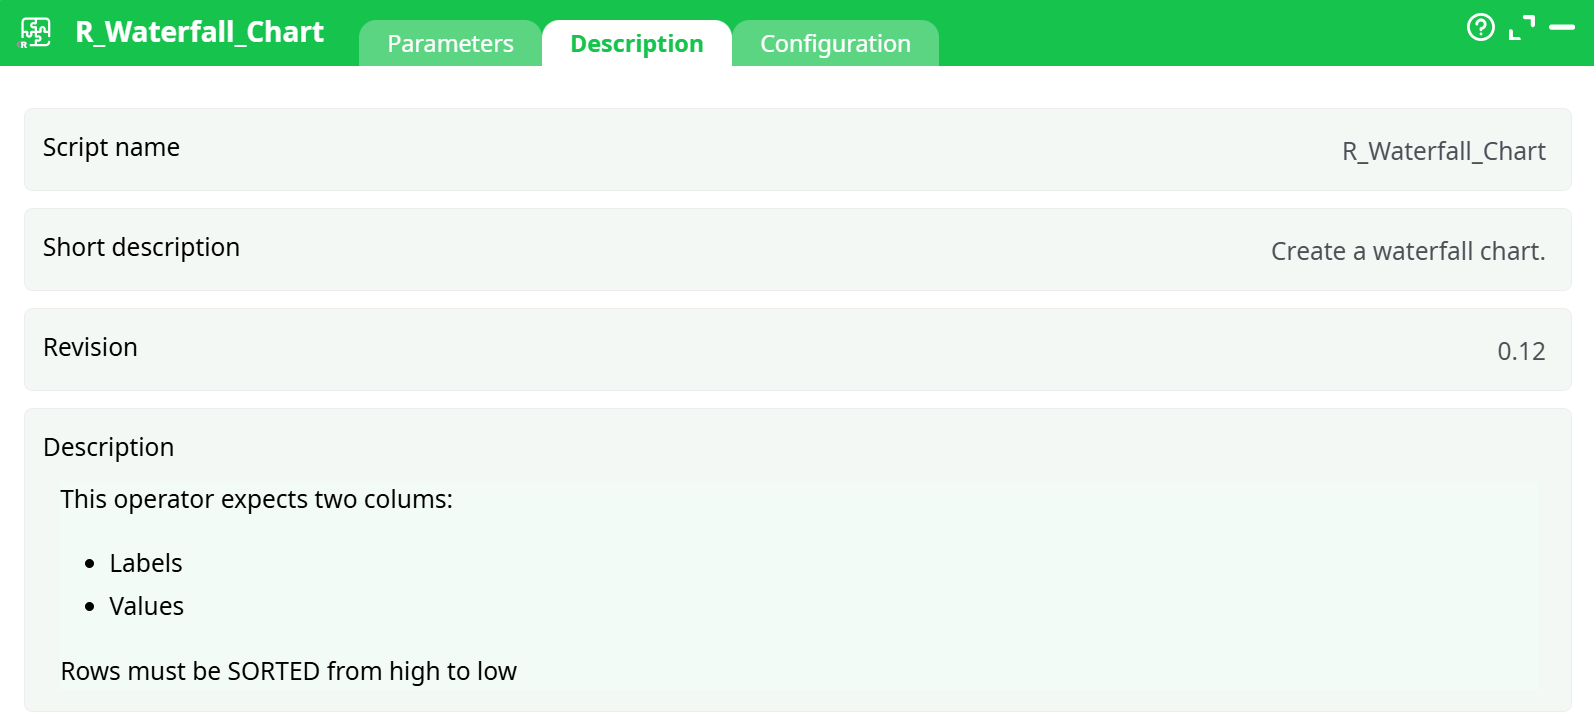
Parameters:
- Script name
- Short description
- Revision
- Description
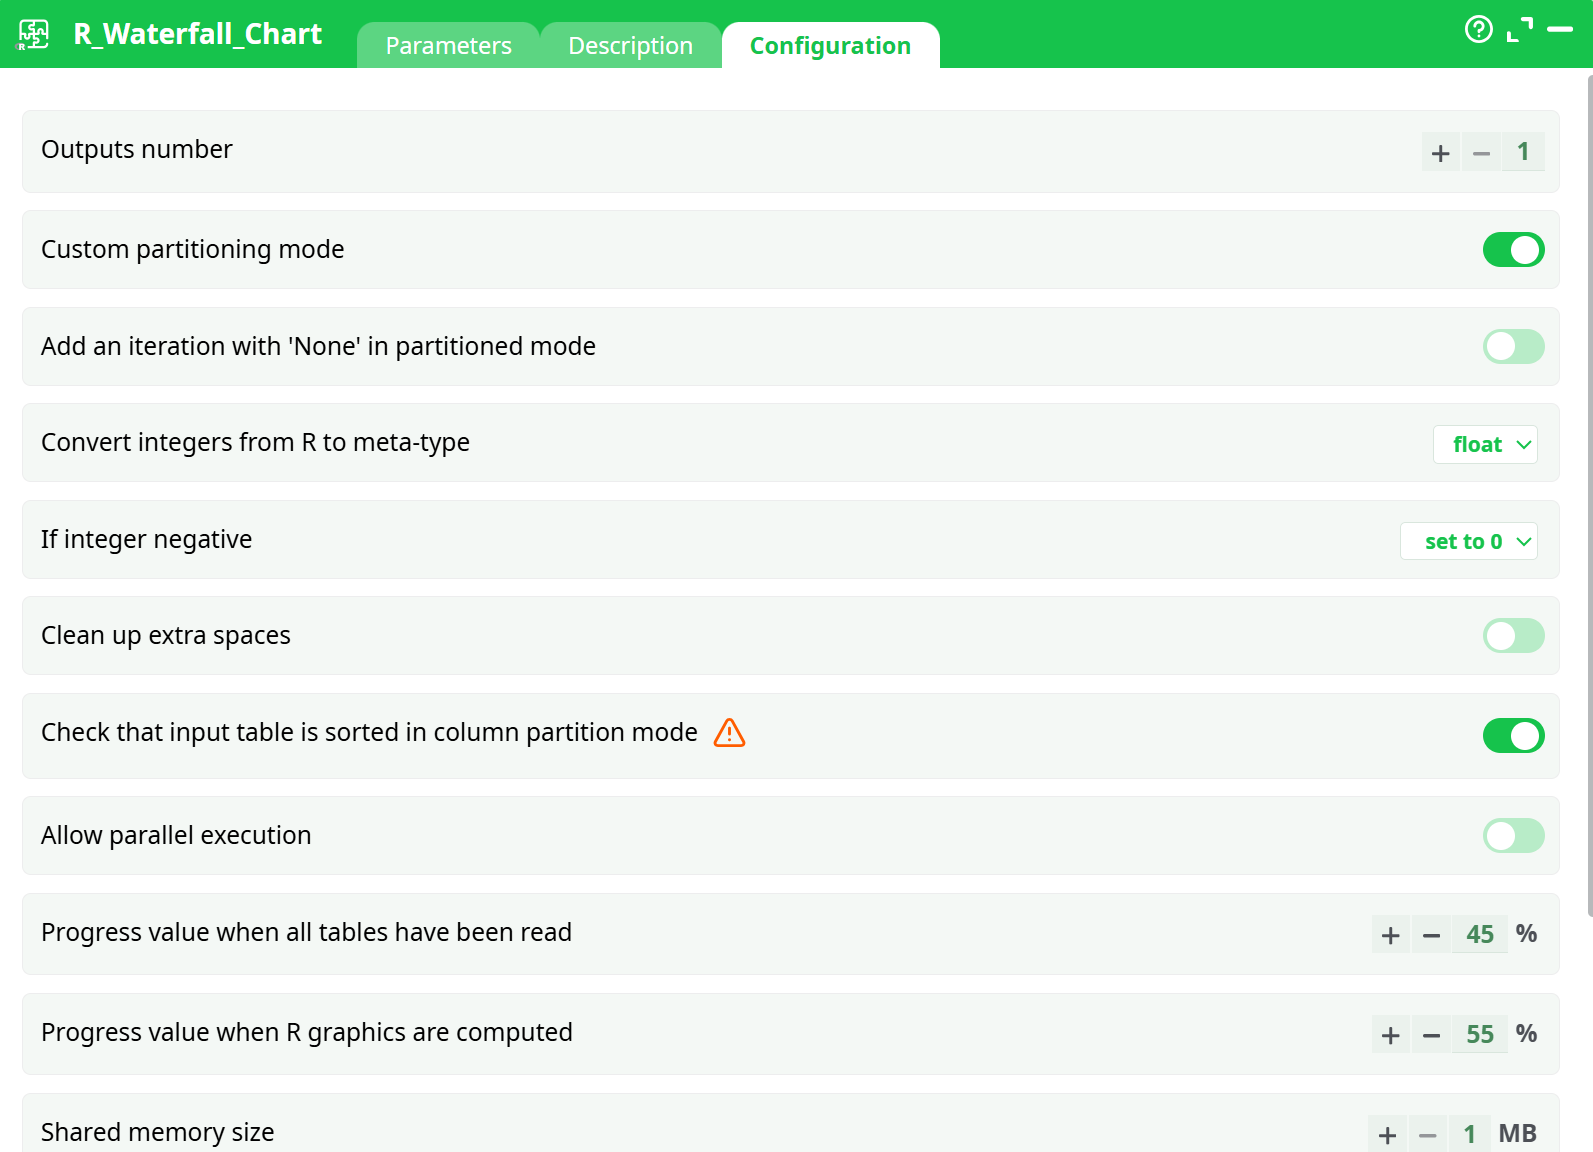
¶ Configuration tab
¶ About
The R_Waterfall_Chart action button generates a waterfall chart using R, providing a clear visual representation of sequential positive and negative contributions to a total value. This visualization is especially useful for financial reporting (e.g., profit and loss analysis), cost breakdowns, or operational impact assessments.
By processing a sorted dataset of labels and numeric values, the action highlights how each element contributes to the overall result. The chart can be customized with labels, titles, fonts, and output format (HTML).
¶ How It Works
-
Input Data
-
The action requires a dataset with at least two columns:
- Labels: Descriptions of each step/category.
- Values: Corresponding numeric amounts (positive or negative).
The Values column must be strictly numeric. Any non-numeric entries (e.g., "NA", "Total", "€1000", empty cells) will cause errors in processing. Pre-cleaning is strongly recommended.
-
-
Sorting Requirement
- Rows must be sorted in descending order by value before being processed.
- Sorting ensures correct cumulative calculations for the chart.
-
Chart Construction
- Each row is interpreted as a step in the sequence.
- Positive values are shown as upward contributions, while negative values appear as downward contributions.
- The final bar represents the cumulative total.
-
Optional Features
- Custom titles (main, X-axis, Y-axis).
- Adjustable font size for labels.
- Optional sub-totals, though these should be disabled when troubleshooting.
- Choice of output format: HTML (interactive), PNG, or PDF.
¶ Configuration
Below are the main configuration properties available in the R_Waterfall_Chart action button:
- Label data → Select the column with category names.
- Numeric data → Select the numeric column containing values.
- Grouping column → Leave empty for most use cases.
- Y-axis title → Custom text for the vertical axis.
- X-axis title → Custom text for the horizontal axis.
- Plot name → Chart title.
- Output type → HTML document
- Font size → Adjusts label text size.
- Add sub-totals → Boolean switch to insert subtotal bars.
¶ Typical Use Cases
-
Financial Analysis
Show revenue, expenses, and net profit in an easy-to-read breakdown. -
Project Management
Illustrate stepwise contributions of tasks or risks to project cost/timeline. -
Operational Reporting
Display how different factors (e.g., production, transport, overhead) impact overall performance.
¶ Troubleshooting
-
Error:
non-numeric argument to binary operator
→ Ensure the Values column is numeric only. Remove currency symbols, thousand separators, and text entries. -
Error due to Subtotals
→ Disable the Add sub-totals option until the chart renders successfully. -
Empty or Incorrect Output
→ Confirm sorting step is applied before chart generation.
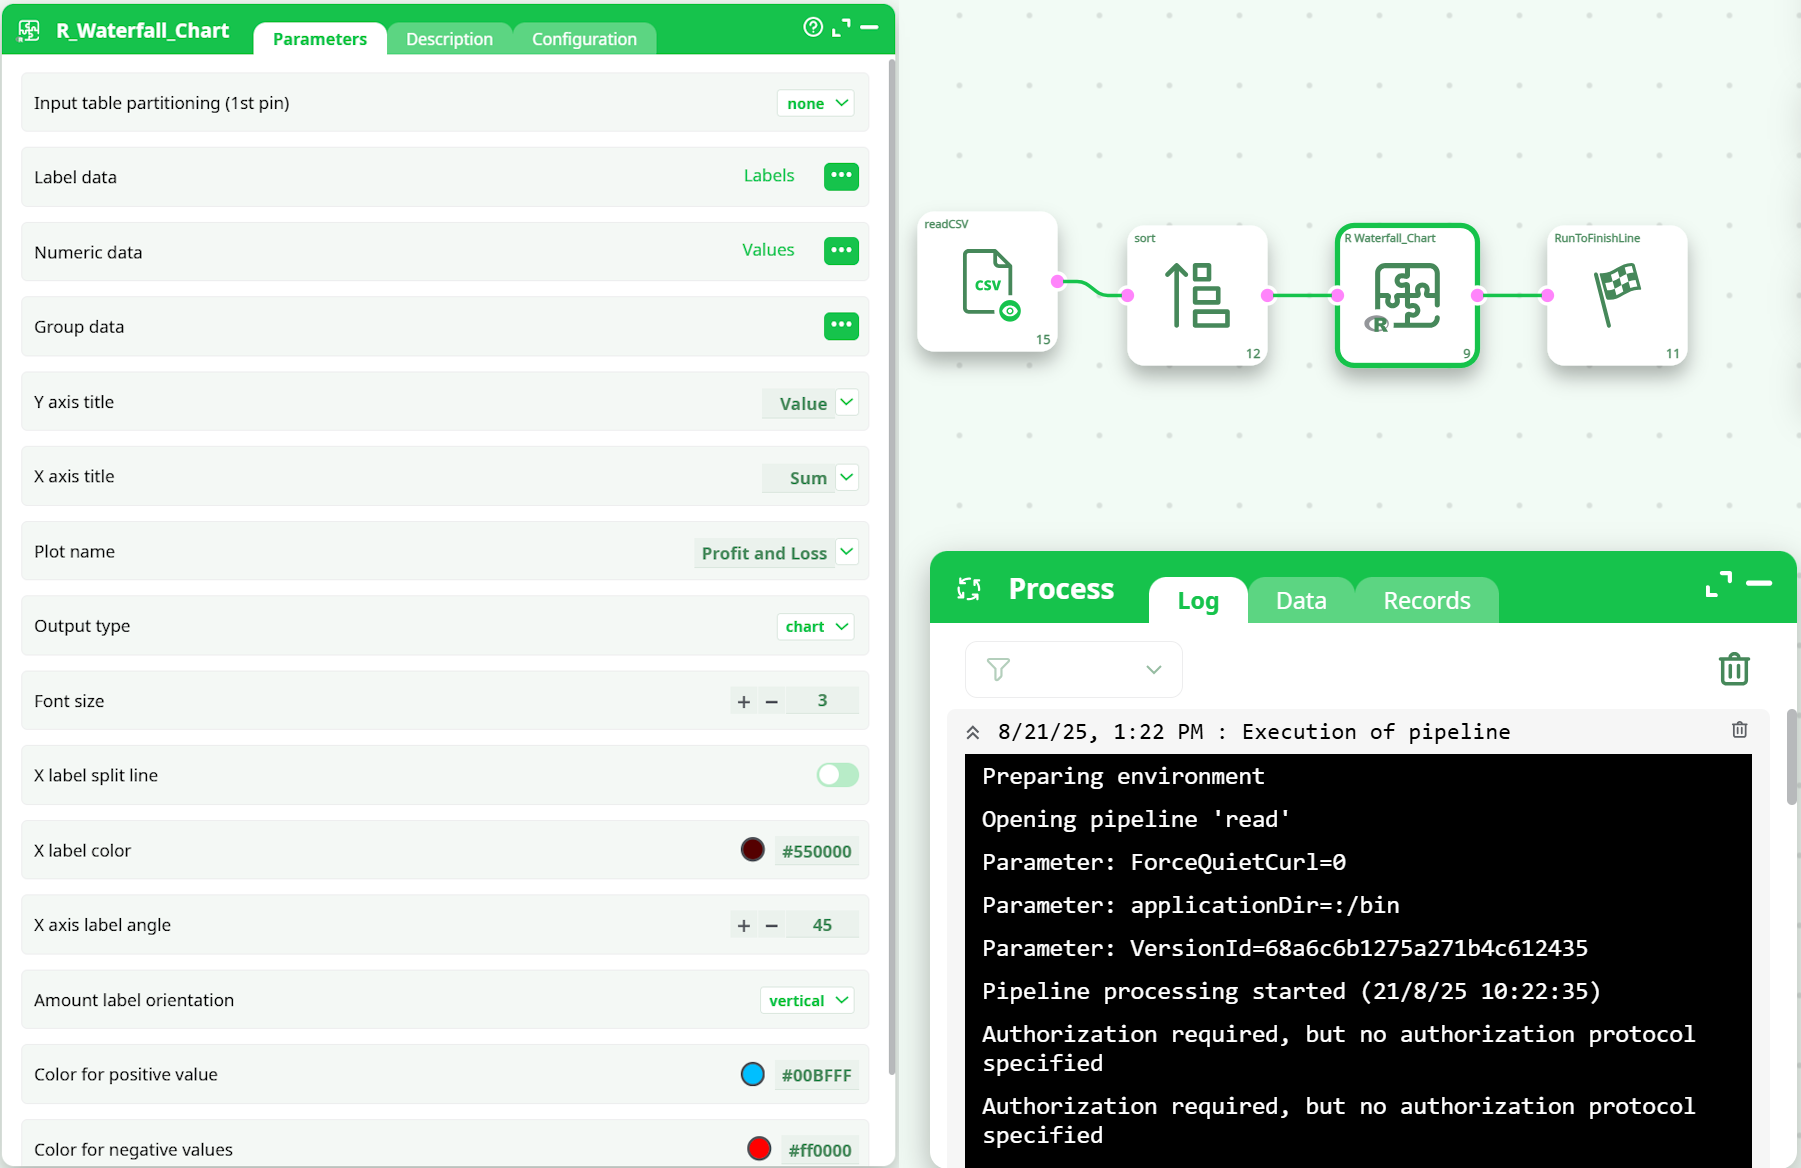
¶ Example Workflow
- readCSV → Import cleaned dataset.
- sort → Apply numerical descending sort on the Values column.
- R_Waterfall_Chart → Configure mapping for Labels and Values.
- RunToFinishLine → View generated waterfall chart.