¶ Description
Analyze the performances of a continuous predictive model.
¶ Parameters
¶ Parameters tab
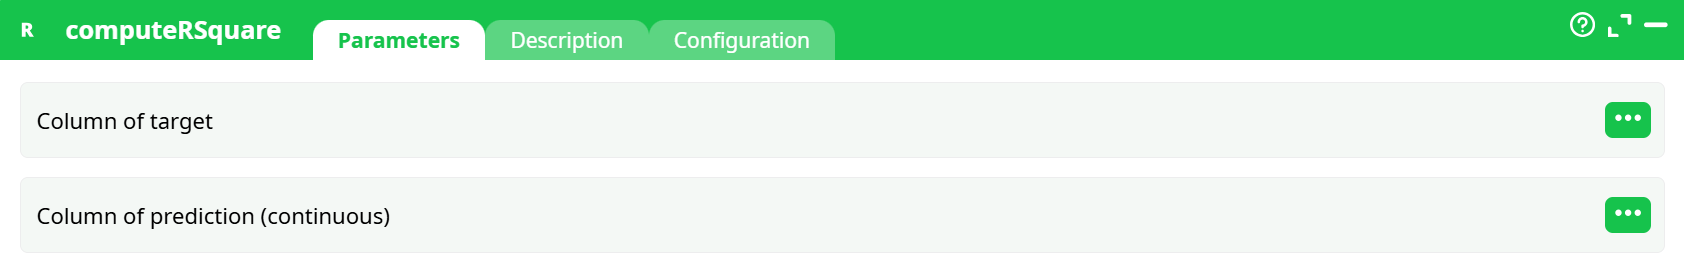
Parameters:
- Column with target
- Column with prediction (continuous)
¶ Description tab
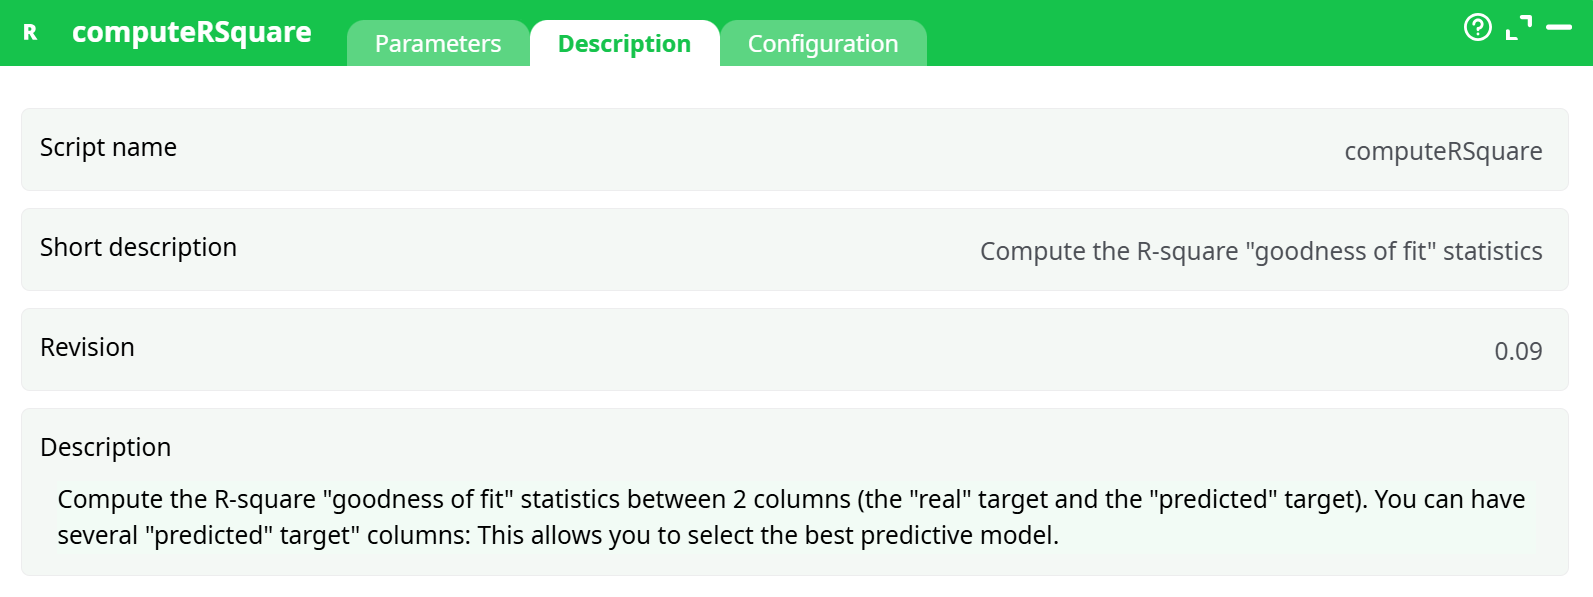
Parameters:
- Short name
- Short description
- Revision
- Description
¶ Configuration tab
See dedicated page for more information.
¶ About
The computeRSquare action computes the R-square "goodness of fit" statistics between two columns:
- One representing the real/true target values.
- One representing the predicted target values.
Additionally, this action also computes:
- MAE (Mean Absolute Error).
- RMSE (Root Mean Squared Error).
- Mean and Standard Deviation of the target column.
This tool is useful for evaluating the performance of predictive models by comparing predicted values with actual observed values.
Notes
Compute the R-square "goodness of fit" statistics between two columns (the "real" target and the "predicted" target). You can have several "predicted" target columns: This allows you to select the best predictive model.
¶ Example Pipeline
¶ Sample Input Table (CSV)
| C1 | C2 |
|---|---|
| 3 | 2.8 |
| 4 | 4.1 |
| 5 | 5.2 |
| 6 | 6.1 |
| 7 | 6.9 |
- C1 = Real target
- C2 = Predicted target
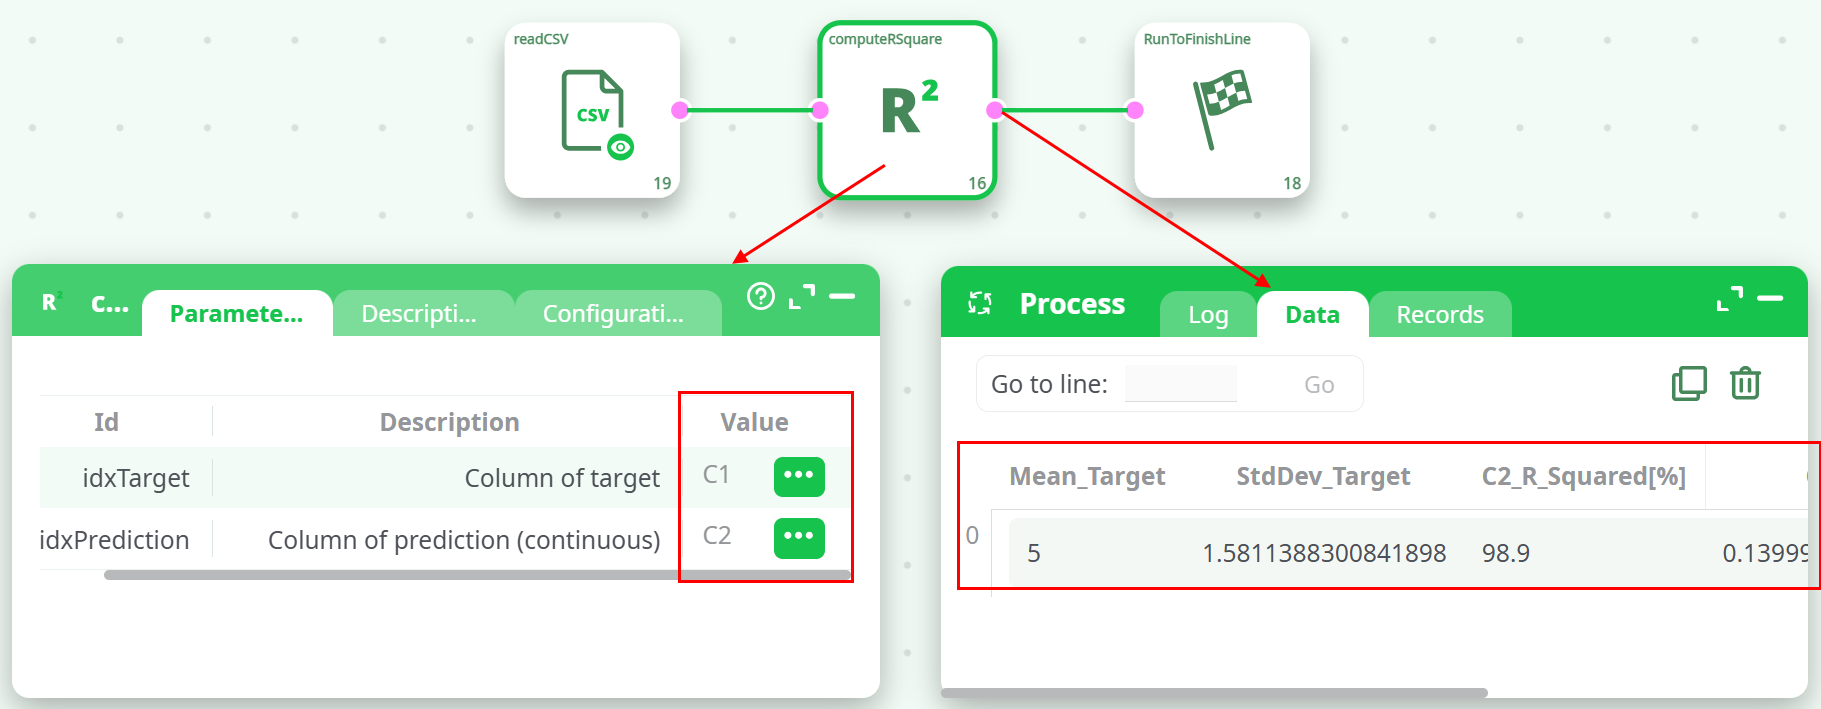
¶ Pipeline Structure:
- readCSV → Reads the CSV file with real and predicted values.
- computeRSquare → Computes the R-square and error metrics.
- RunToFinishLine → Completes the pipeline.

¶ computeRSquare Settings:
Column of target: C1Column of prediction (continuous): C2
¶ Example Output Table
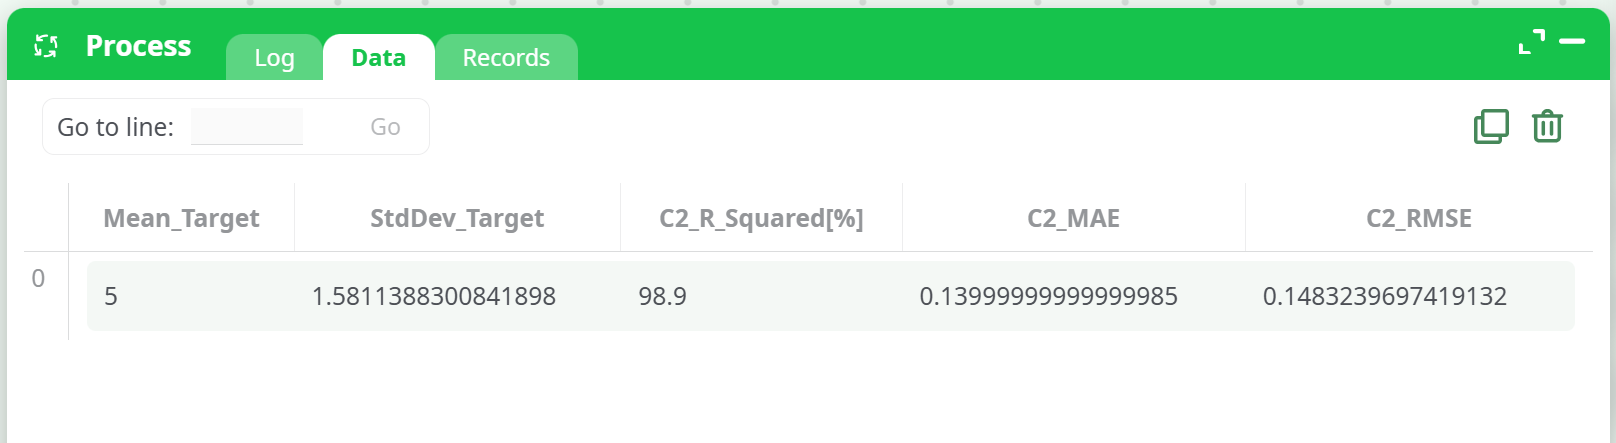
Notes
- Higher R-square values indicate better fit (maximum value: 100%).
- Lower MAE and RMSE values indicate better prediction accuracy.
- Easy integration into model evaluation pipelines.
¶ Best Practices:
- Always ensure the target and prediction columns are correctly selected.
- Use this action after predictive models to compare different models’ accuracy.