¶ Description
Download logs from a Splunk server.
¶ Parameters
¶ Parameters tab
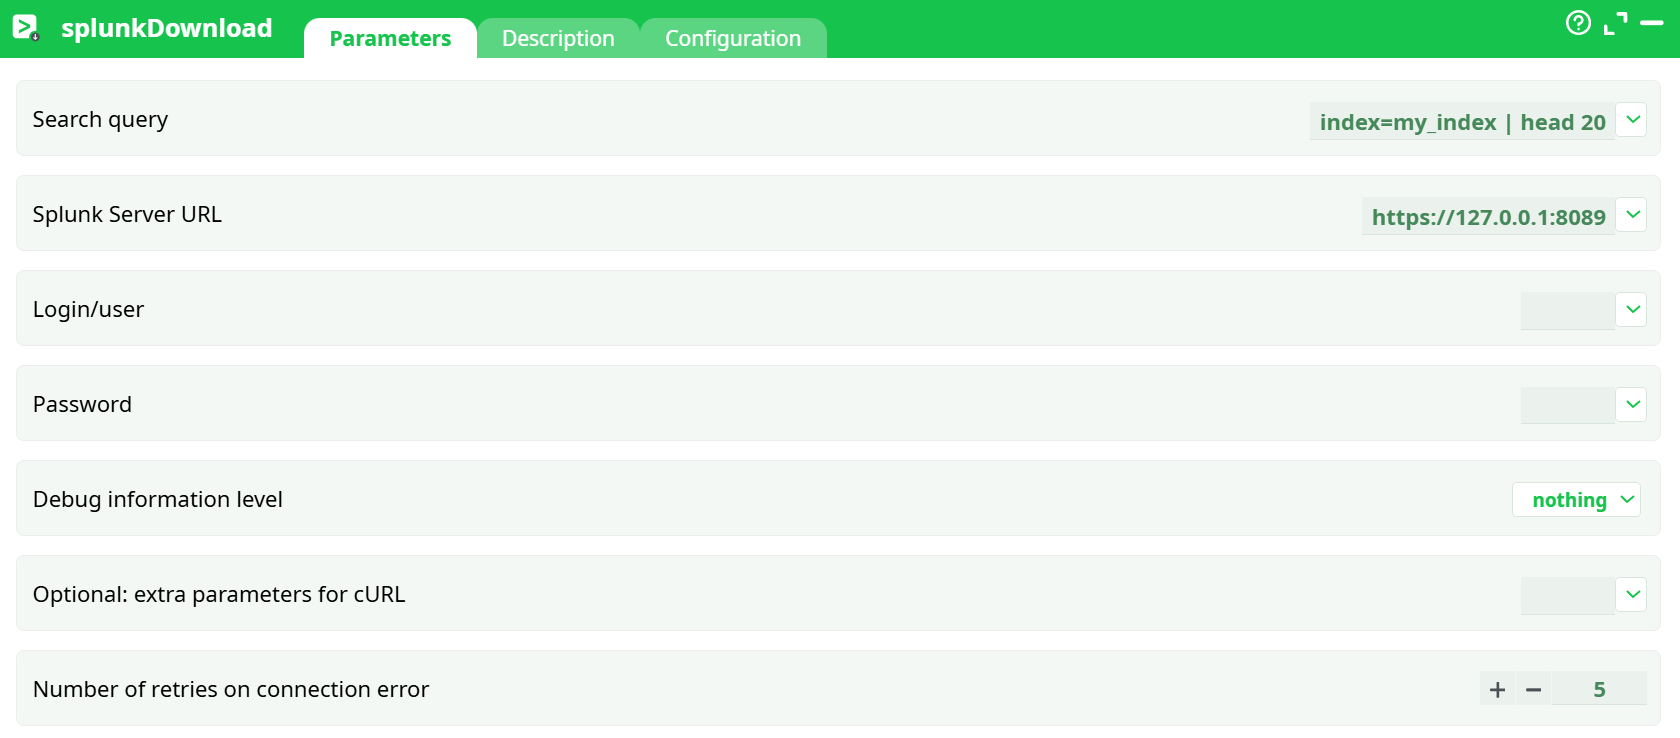
Parameters:
- Search query
- Splunk Server URL
- Login/user
- Password
- Debug information level
- Optional: extra parameters for cURL
- Number of retries on connection error
¶ Description tab
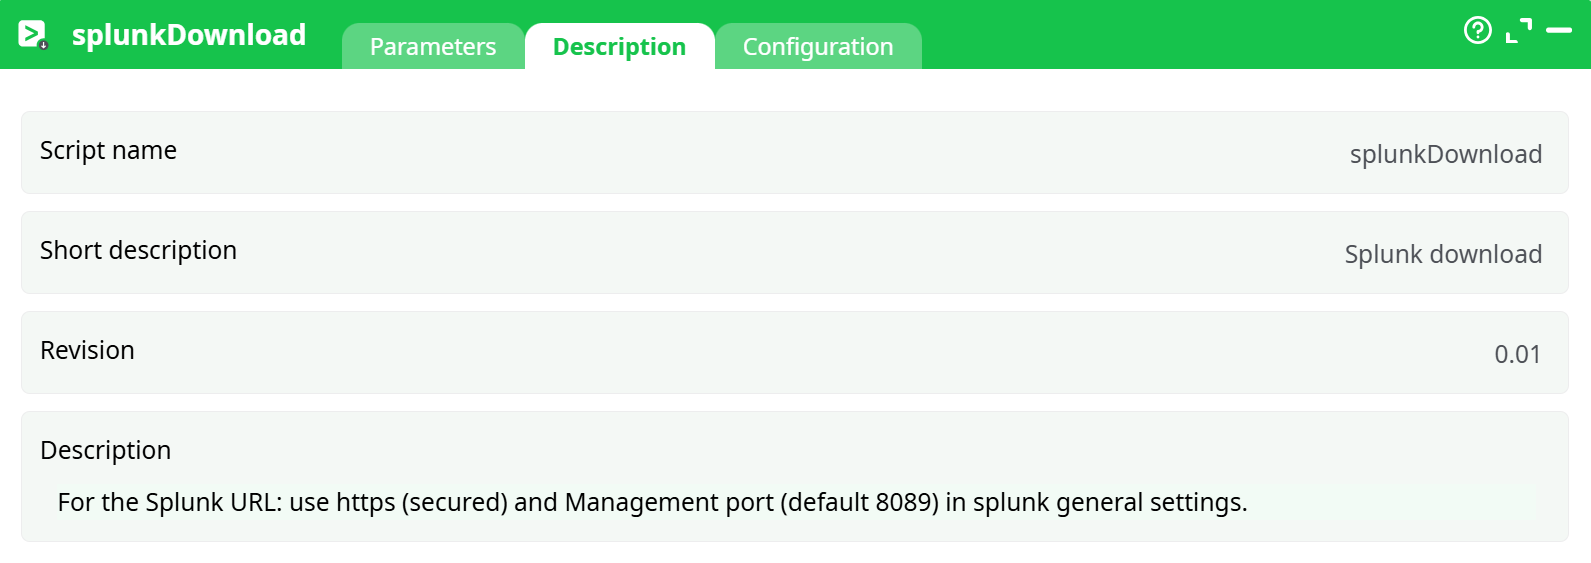
Parameters:
- Script name
- Short description
- Revision
- Decription
¶ Configuration tab
See dedicated page for more information.
¶ About
Runs a Splunk Search and downloads the results as table rows into the pipeline.
¶ Quick setup (Splunk side)
- Have a Splunk instance (Cloud or Enterprise) you can reach from the worker.
- Enable the Management Port in Splunk settings
Settings ▸ Server settings ▸ General settings ▸ Splunk management port → keep/enable 8089 (HTTPS). - User & perms: the account you use must be able to run the search you provide (read access to the target indexes).
- (Optional) If you use a proxy, make sure the worker has outbound HTTP(S) via that proxy (this action supports proxy access).
¶ Example
- Search query:
index=web sourcetype=access_combined status>=500 earliest=-15m | stats count by status - Splunk Server URL:
https://splunk.mycorp.com:8089 - login/Password: your Splunk API user
Run the pipeline; the action emits rows with the fields returned by Splunk (e.g., status, count)
¶ Notes & compatibility
- Search syntax reference: see Splunk’s Search reference:
https://docs.splunk.com/Documentation/SCS/current/SearchReference/Introduction - Proxy support: This action also works when accessing the web through a PROXY server.
- Port requirement: For this action to work you need to enable the Splunk Management Port in Splunk. This is usually port 8089.
¶ Troubleshooting
- 401 Unauthorized / 403 Forbidden
Wrong credentials or the user lacks permissions to the index. Test the same search in Splunk with that user. - Could not connect / timeout
Check network reachability tohost:8089(and proxy rules if used). Ensure HTTPS is enabled on the management port. - TLS/SSL errors
If your Splunk uses a custom certificate, add the CA to the worker trust store or pass appropriate cURL options via Optional: extra parameters for cURL. - “Unknown index” or empty result
Verify theSearch queryand time window; confirm the index exists and contains data for the time range.