¶ Description
Compute, save and display lift curve.
¶ Parameters
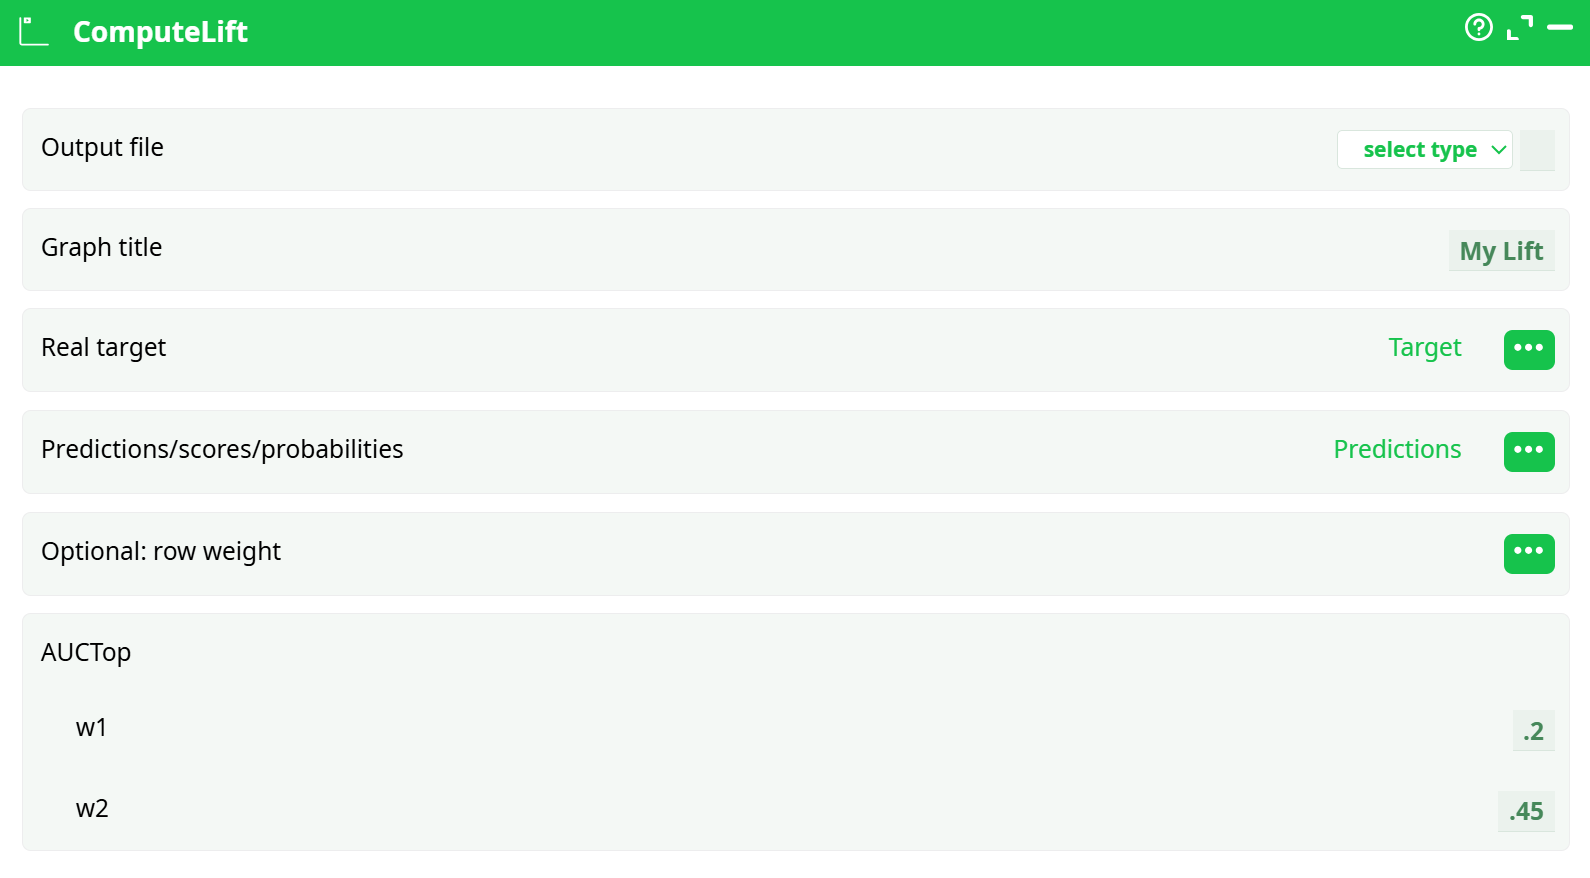
Parameters:
- Output lift file
- Graph title
- Real target
- Predictions/scores/probabilities
- Optional: row weight
- AUCTop
- w1
- w2
¶ About
The ComputeLift action is designed to generate a Lift Curve from prediction data to evaluate the performance of a binary classifier. It visualizes the model’s effectiveness at identifying positive class instances compared to random selection, and computes important evaluation metrics like AUC and AUCtop.
The Lift chart is a crucial tool for interpreting model outputs in marketing, credit scoring, fraud detection, and other applications where ranking predictions and evaluating top segments is essential.
¶ How It Works
The action sorts rows by prediction scores in descending order and plots:
- Lift curve: cumulative % of actual targets (true positives) vs population.
- Random baseline: expected performance by random chance.
- AUC (Area Under Curve): Overall model ranking quality.
- AUCtop: Focused performance between w1 and w2 cutoffs (useful in marketing).
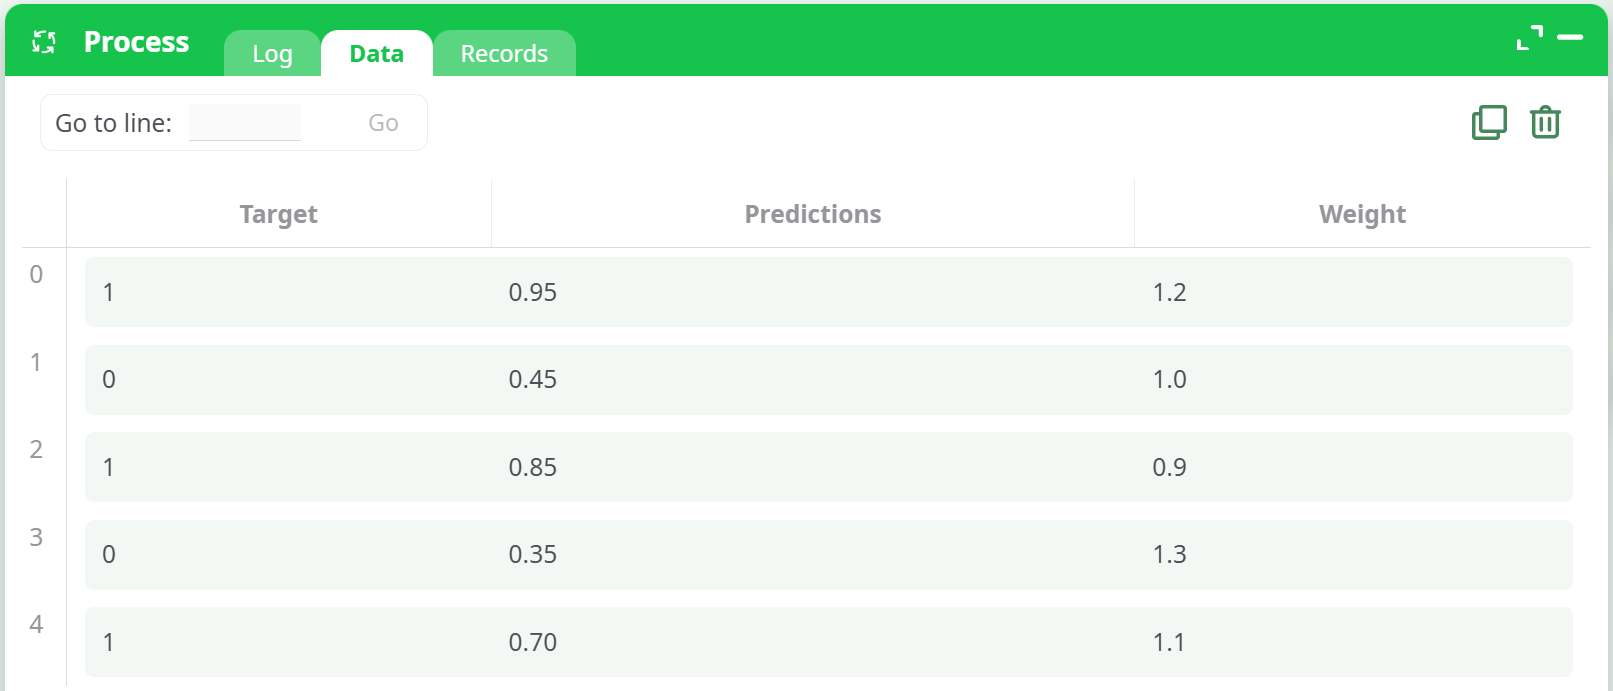
¶ Input Example
Prepare a table with at least these 2 columns:
| Target | Predictions | Weight |
|---|---|---|
| 1 | 0.95 | 1.2 |
| 0 | 0.45 | 1.0 |
| 1 | 0.85 | 0.9 |
| 0 | 0.35 | 1.3 |
| 1 | 0.70 | 1.1 |
Target: Binary class labels (0 or 1)Predictions: Probabilistic model outputs (float between 0 and 1)Weight(optional): Custom importance for each row
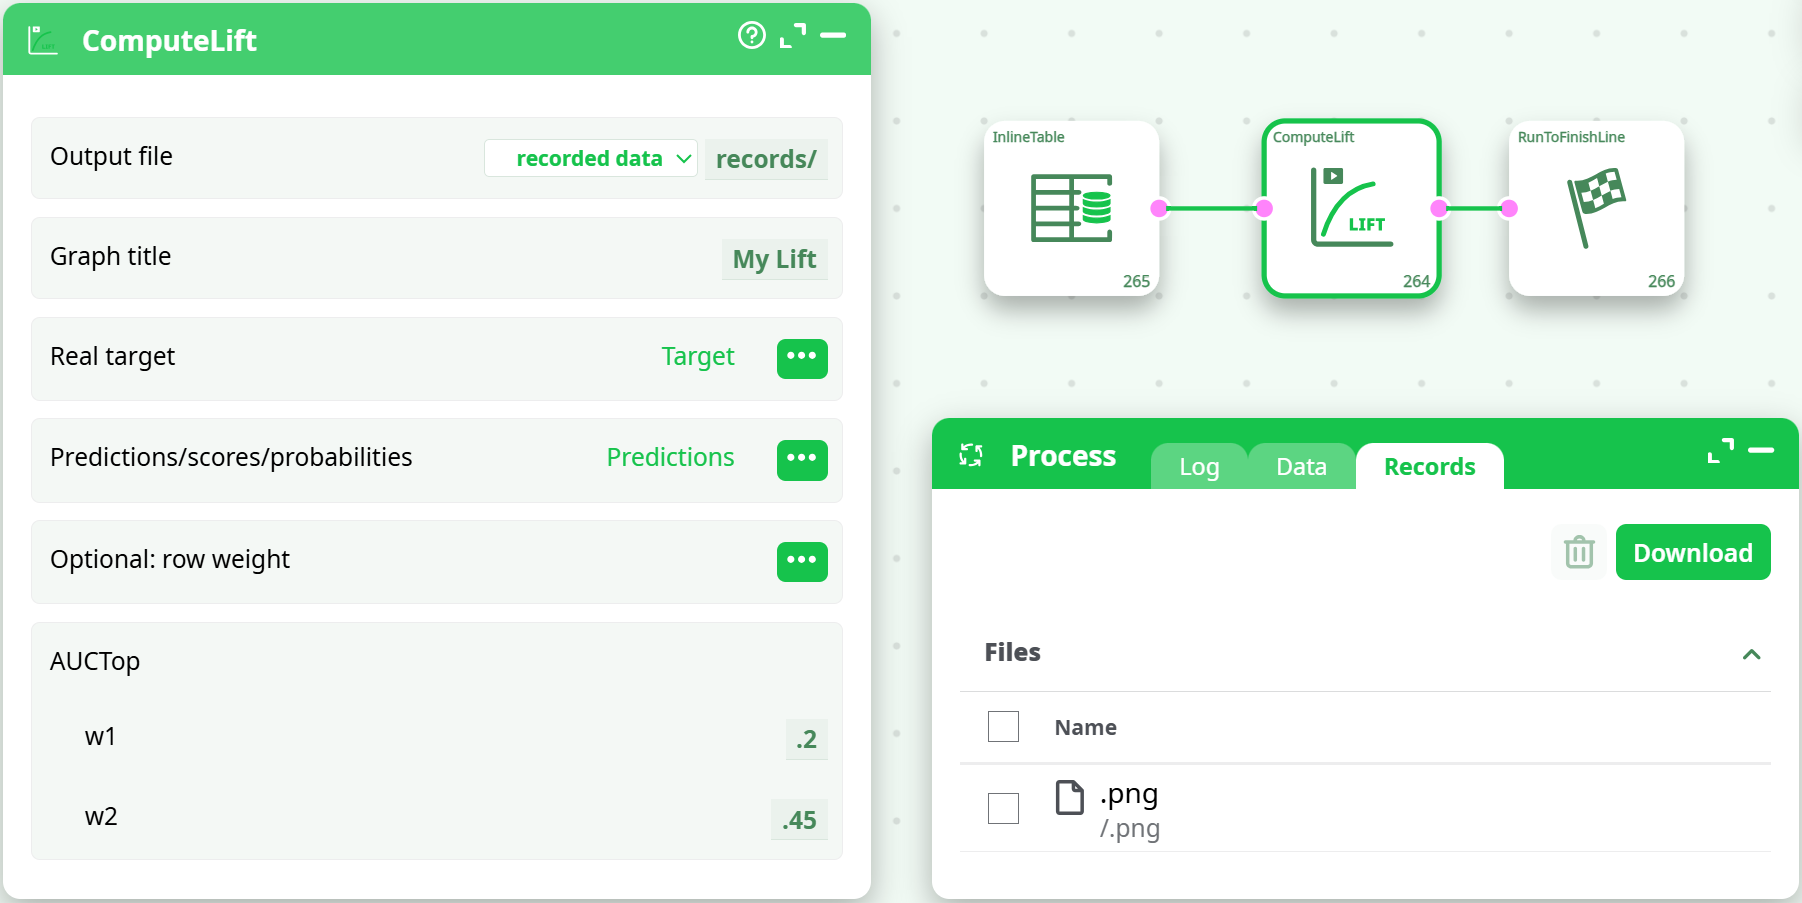
¶ ▶️ How to Run
- Add an InlineTable or import your dataset with real labels and predicted scores.
- Connect the ComputeLift action to the dataset.
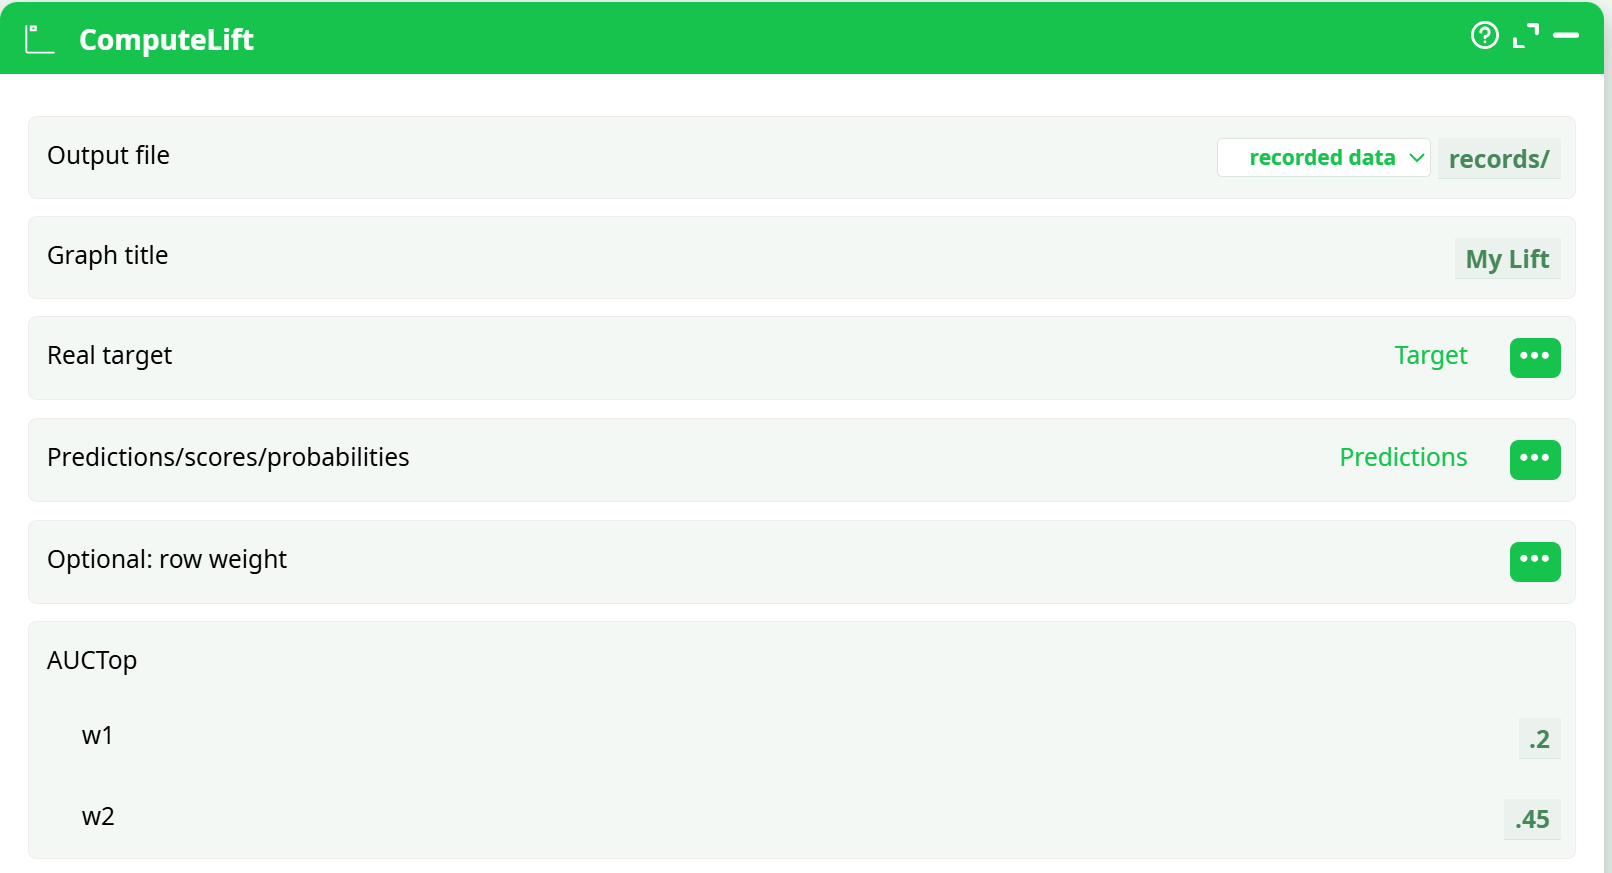
- Configure parameters:
- Select your Target column (e.g.,
Target) - Select Predictions column (e.g.,
Predictions) - (Optional) Assign the Weight column
- Set Graph title (e.g.,
My Lift) - Set AUCtop w1 and w2 (e.g.,
0.2and0.45) - Choose output file path:
recorded data → records/
- Select your Target column (e.g.,
- Run the pipeline.
- A Lift Chart
.pngwill be generated and appear in the Records tab.
¶ Output
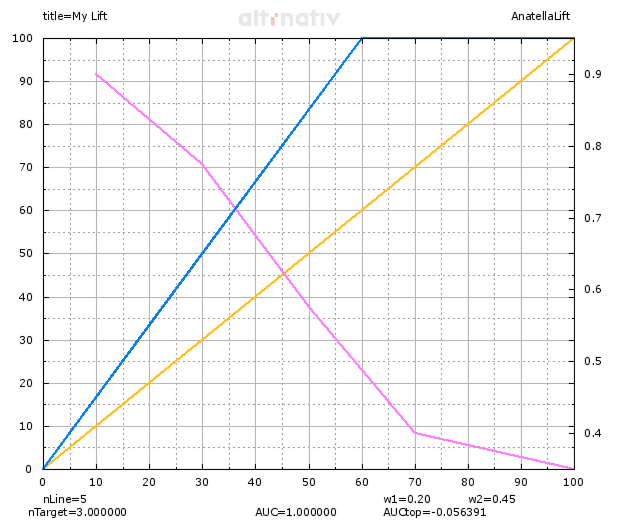
- Lift Curve PNG with visual indicators:
- Blue: Cumulative % of true positives
- Orange: Baseline (random)
- Purple: Lift vs baseline
- Metrics printed:
nLine= Total rowsnTarget= Count of positive classAUC= Area under full curveAUCtop= Local performance between w1–w2
¶ Example Screenshots
¶ Action Configuration
¶ Input Table
¶ Output Preview

¶ Use Cases
- Evaluate the performance of classification models
- Optimize marketing campaigns by targeting top predicted segments
- Compare model lift across different datasets or versions
- Track model performance over time via automated pipelines
¶ Notes
- Only binary classification is supported.
- Prediction scores should be normalized probabilities (0–1).
- AUC and AUCtop are independent of threshold.
- The graph is static (
.png) and can be used in reports or presentations. - If no weights are given, uniform weights are assumed.
¶ Troubleshooting
| Error Message | Possible Cause | Solution |
|---|---|---|
| “Missing predictions or target column” | Misconfigured input | Ensure both columns are selected |
| “Empty graph / AUC=0” | Poor model or bad label alignment | Check data and prediction column |
| “No graph in Records tab” | Output path not selected | Choose valid output destination |
| “AUCOtop is negative or low” | Model scores not discriminative in top % | Investigate model behavior or redefine w1/w2 |