¶ Description
Propagation simulation of a disease in a social graph.
¶ Parameters

Parameters:
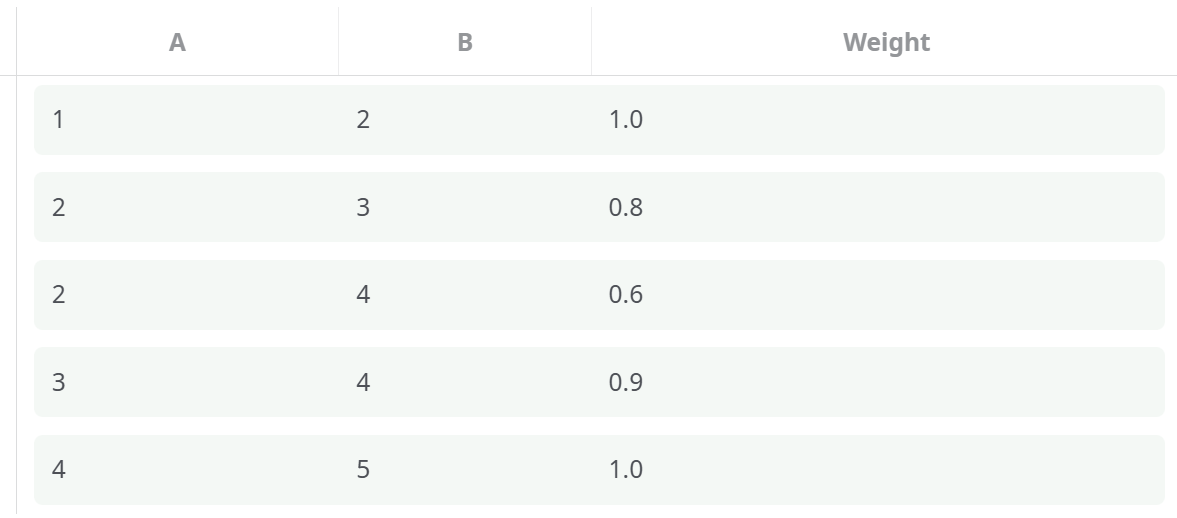
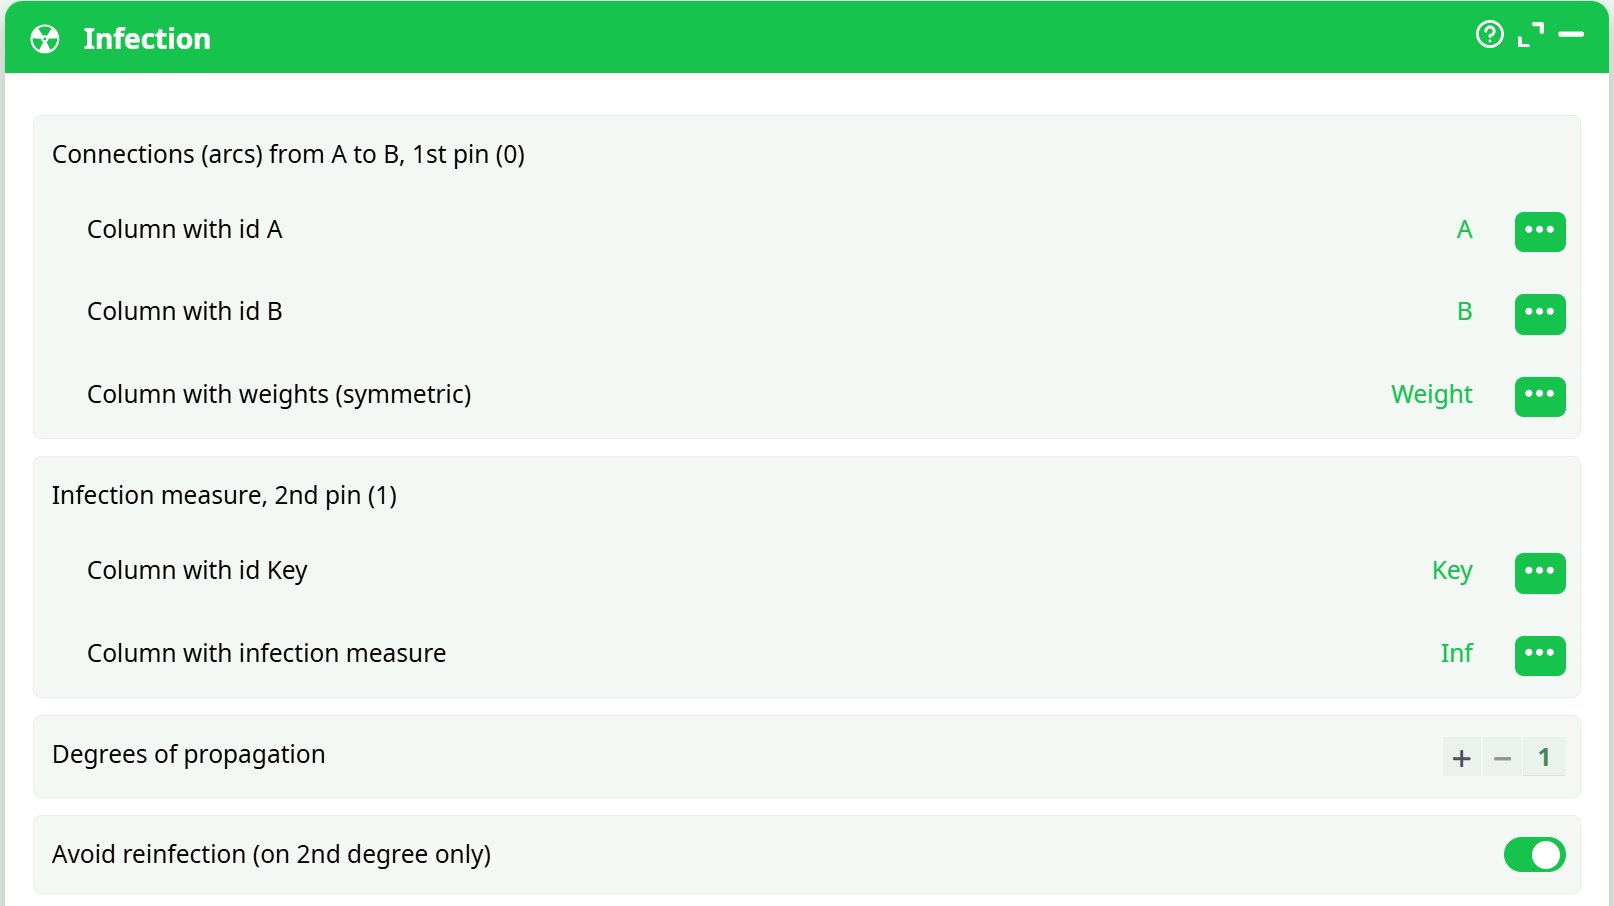
- Connection (arcs) from A to B, 1st pin (0)
- Column with id A:
- Column with id B:
- Columns with weights (symmetric):
- Infection measure, 2nd pin (1)
- Column with id key:
- Column with infection measure:
- Degrees of propagation:
- Avoid reinfection (on 2nd degree only):
¶ About
The Infection action simulates the propagation of an infection (or influence) through a network graph, starting from an initial infected set of nodes and propagating through weighted edges. The result is a new table containing each node’s infection value across defined propagation degrees.
¶ Input Pins
¶ Pin 0 — Connections Table
¶ Pin 1 — Infection Measure Table

¶ Example Configuration
- Degrees of propagation:
1 - Avoid reinfection: Enabled
¶ Output
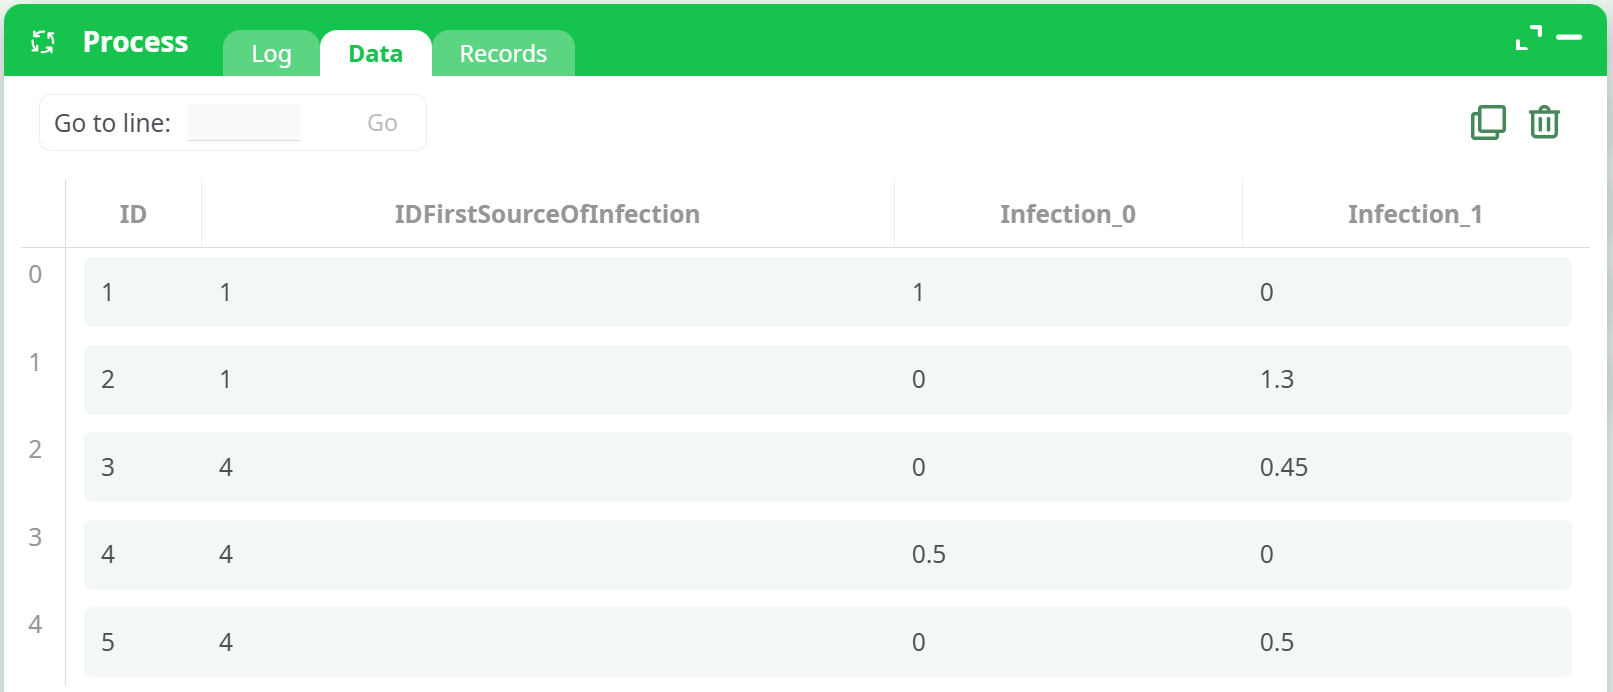
The output includes a table with the following columns:
| Column | Description |
|---|---|
ID |
Node identifier |
IDFirstSourceOfInfection |
The original infection source ID |
Infection_0 |
Infection value at degree 0 (original nodes) |
Infection_1 |
Infection value after 1st-degree propagation |
¶ Sample Output
¶ Notes
- Edge weights influence how much infection is passed.
- Degrees of propagation determine how far the infection spreads.
- This action is ideal for modeling network-based spread dynamics such as disease transmission, viral marketing, or risk diffusion.
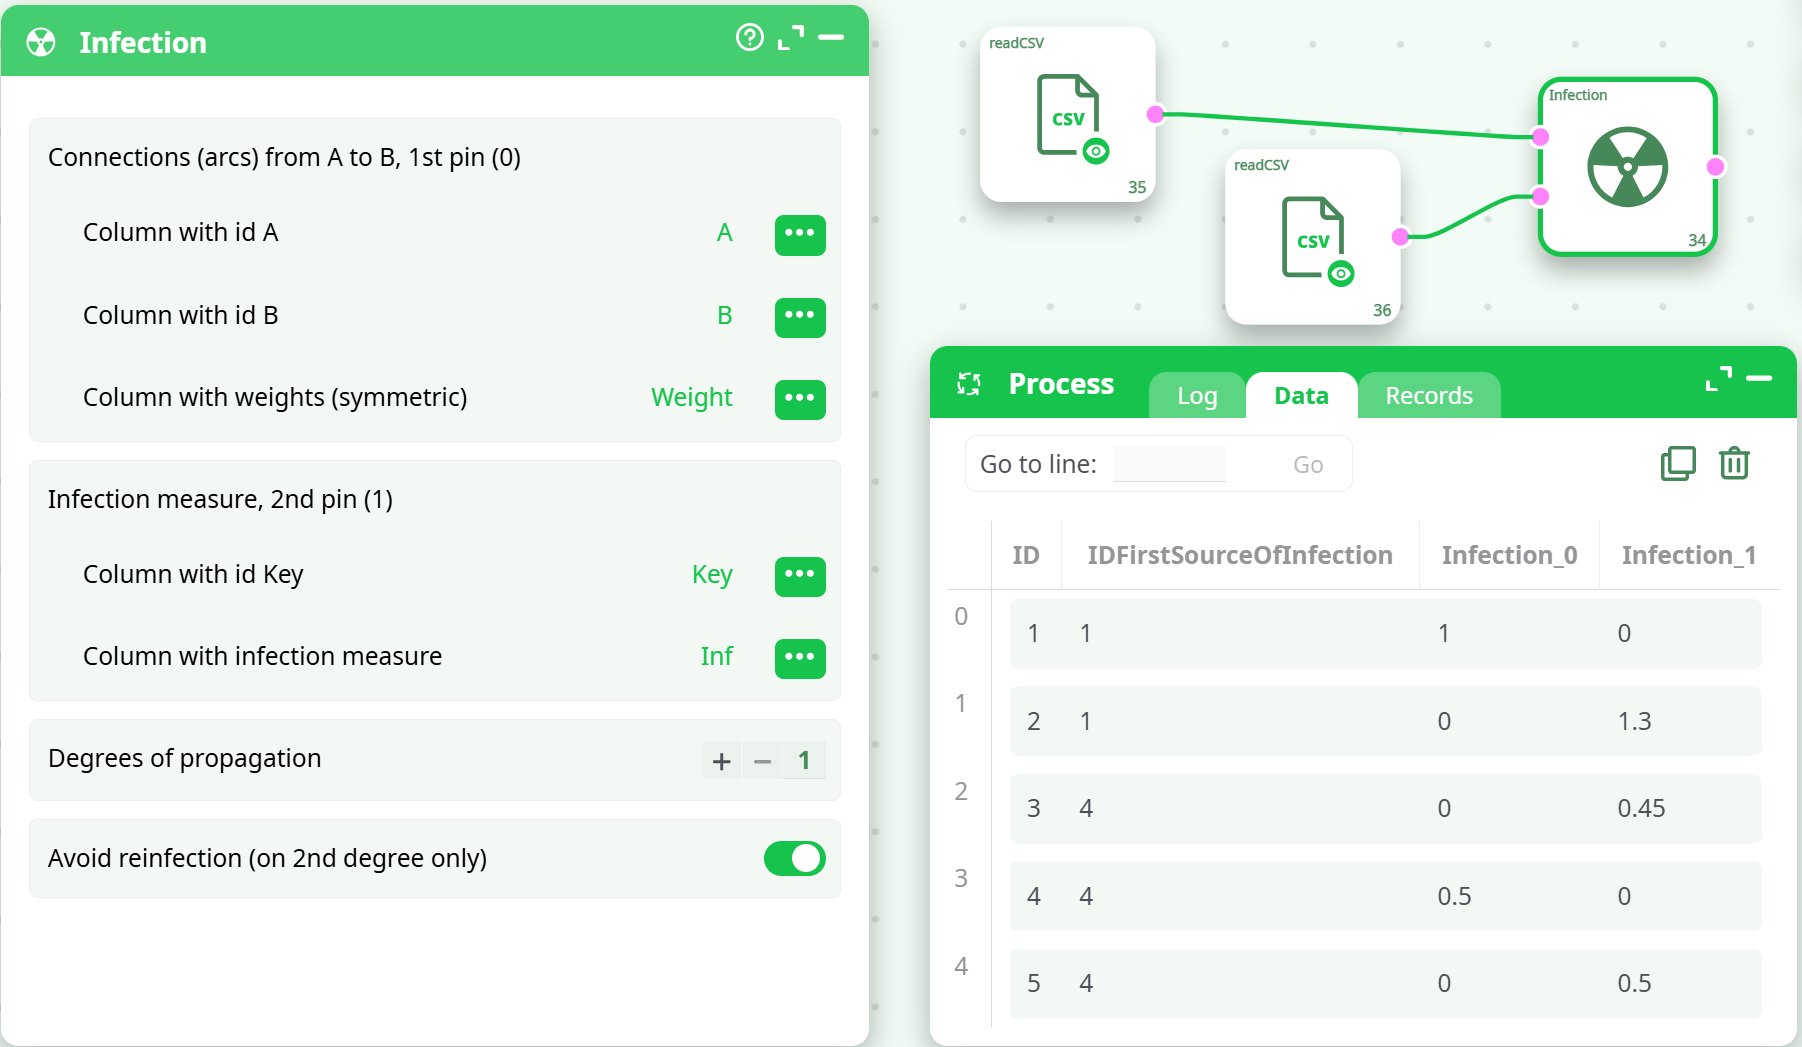
¶ Testing Pipeline
The test pipeline includes:
- Two input CSVs (connections and initial infections)
- The Infection action button
- A successful execution and expected output
¶ How It Works & When to Use
The Infection action button models the spread of influence, information, or infection across a network of nodes (e.g., people, devices, or locations). It uses a graph structure where connections (edges) between entities (nodes) are defined with a weight representing the strength or likelihood of transmission.
¶ Propagation Logic
-
Initial Input:
- You provide a list of connections between nodes (Pin 0) with optional weights.
- You provide a list of initially "infected" nodes with their infection values (Pin 1).
-
Computation:
- Each infected node propagates its infection to its neighbors proportionally to the connection weights.
- The spread can happen over multiple degrees (or steps), configured via
Degrees of propagation. - Optionally, the system can prevent reinfection at the 2nd degree — useful when modeling spread that shouldn’t loop back to a recently infected node.
-
Output:
- The result is a table showing infection values at each degree level per node.
- For example,
Infection_0shows original infection values, whileInfection_1shows values after one degree of propagation.
¶ Common Use Cases
| Domain | Application Example |
|---|---|
| Epidemiology | Modeling disease spread between people or regions |
| Social Networks | Tracking rumor or information spread on social media |
| Cybersecurity | Simulating malware propagation in a device or server network |
| Risk Analysis | Propagating financial or operational risk between connected assets |
| Marketing | Estimating customer influence or word-of-mouth promotion effects |
¶ Tips & Best Practices
- Start with 1 degree of propagation to test the setup.
- Visualize or sort the output to identify top receivers of infection.
- Ensure node IDs are consistent between both input files.
- Use higher
Degrees of propagationfor complex chains, but monitor performance.