¶ Description
Compute Quantiles and Clever Quantiles.
¶ Parameters
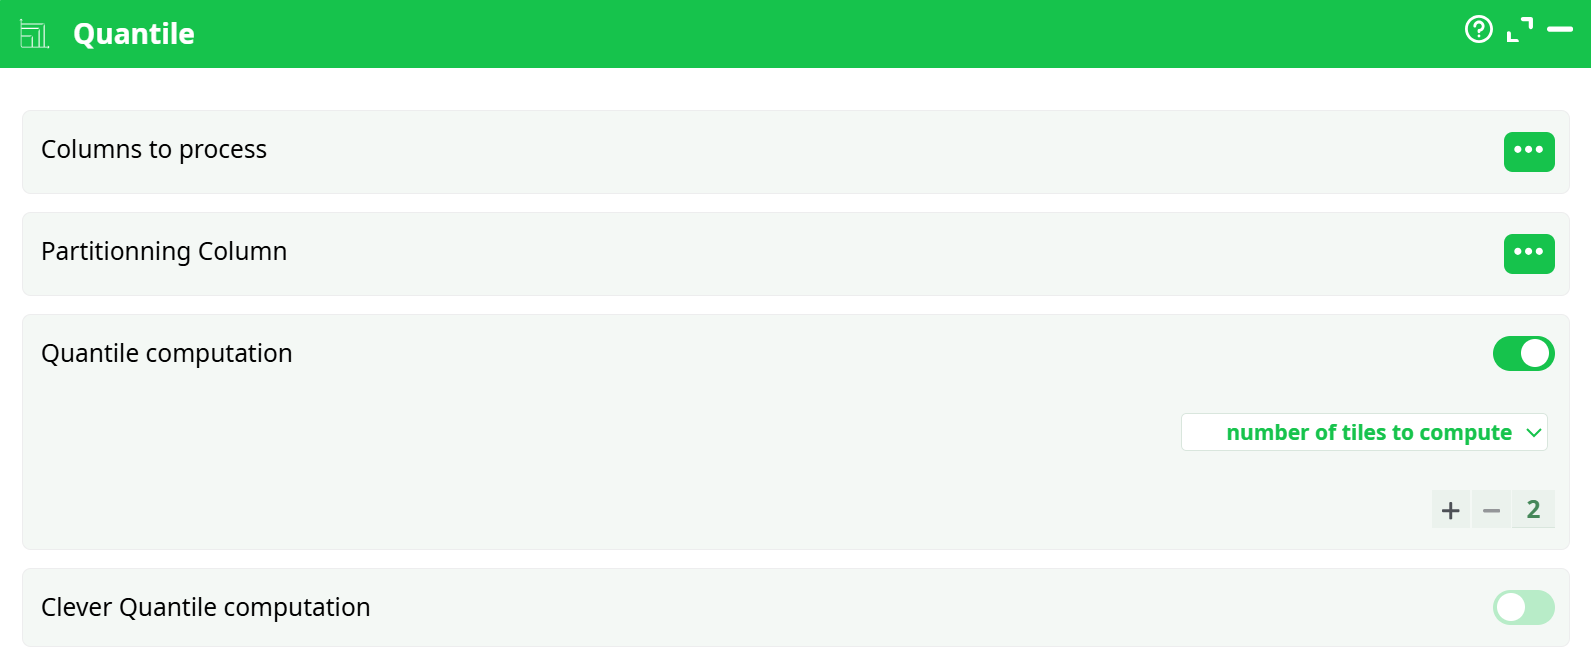
Parameters:
- Columns to process Select the numeric column(s) on which quantiles should be computed.
- Partitioning Column Optional. Specify a column to partition data before quantile computation.
- Quantile computation Enable or disable quantile computation.
- Number of tiles to compute Specify the number of quantiles to compute (e.g., 2 for median, 4 for quartiles)
- Clever Quantile computation Enable for optimized computation on large datasets. (Optional)
¶ About
The Quantile action button computes quantiles for a specified numeric column. It enables the partitioning of data into a defined number of quantile groups (e.g., percentiles, quartiles). This action can also perform optional interpolation for more precise quantile values.
¶ Use Cases
Here are some common use cases for the Quantile action button:
- Customer Segmentation:
- Divide customers into groups (e.g., top 25%, middle 50%, bottom 25%) based on purchase amounts, lifetime value, or scores.
- Risk Analysis:
- Identify low, medium, and high-risk zones in a dataset by computing quartiles or percentiles.
- Outlier Detection:
- Detect extreme values by analyzing lower and upper quantiles, helping to flag outliers for further review.
- Performance Tiers:
- Group employees, products, or processes into performance categories based on numeric KPIs.
- Data Binning for Modeling:
- Prepare features for machine learning models by discretizing continuous variables into quantile bins.
¶ Example Configuration
Input Data Table Example:
| C1 |
|---|
| 10 |
| 20 |
| 30 |
| 40 |
| 50 |
| 60 |
| 70 |
| 80 |
| 90 |
| 100 |
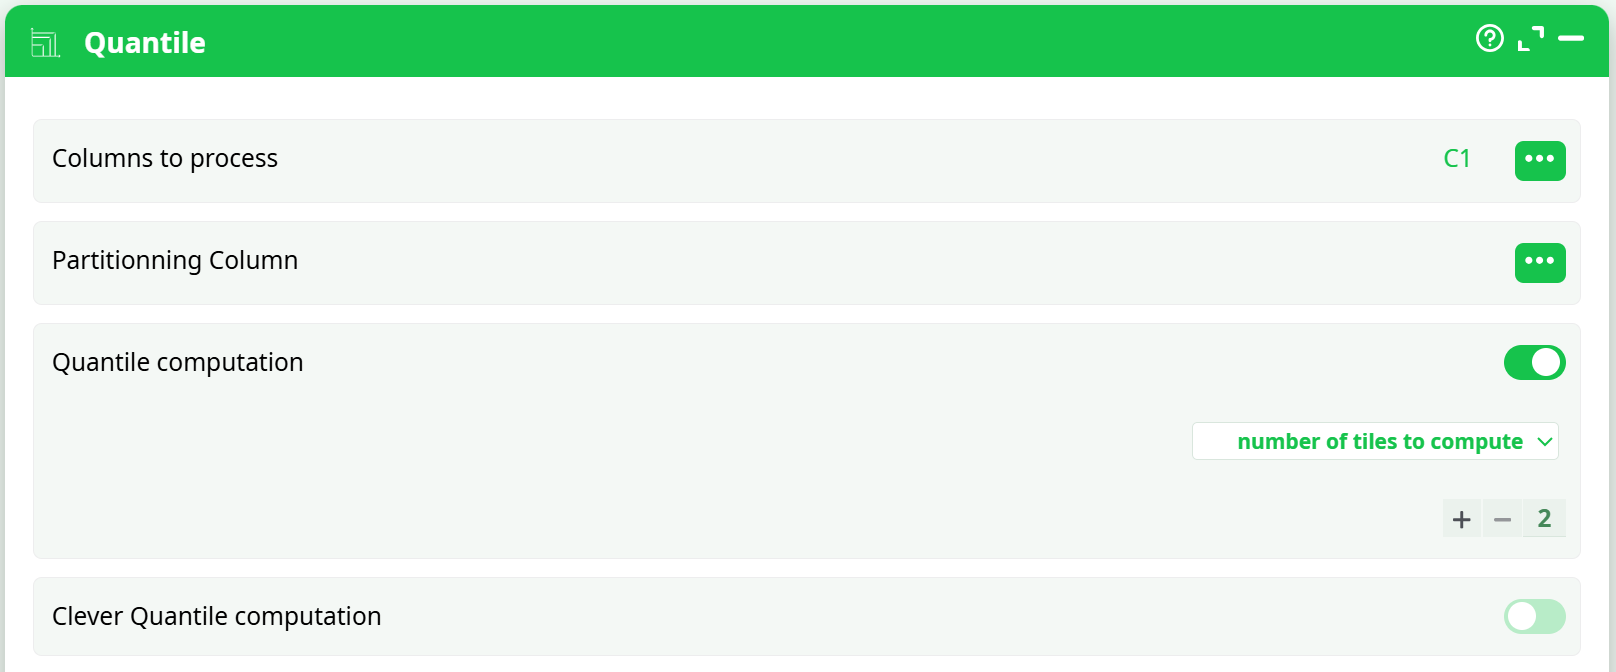
- Column to process:
C1 - Number of tiles to compute: 2 (Median calculation)
- Clever Quantile computation: Disabled
¶ Sample Pipeline Screenshot:
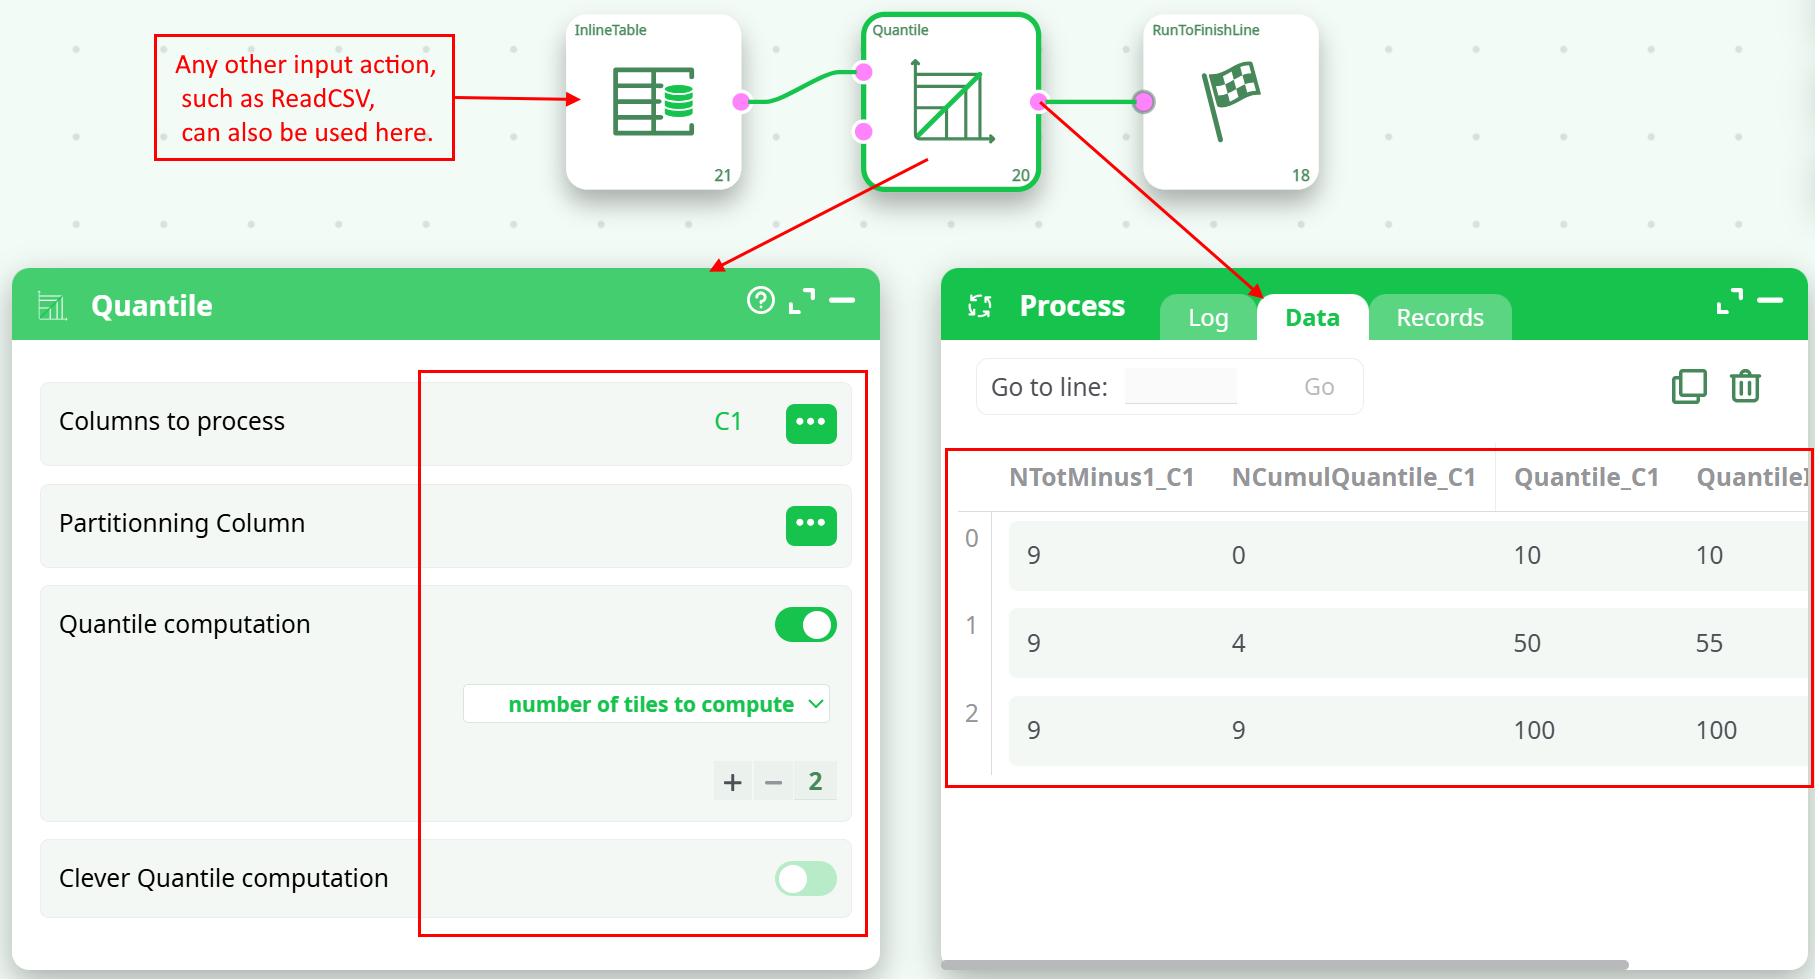
¶ Example Output Table:
| NTotMinus1_C1 | NCumulQuantile_C1 | Quantile_C1 | QuantileInterpolated_C1 |
|---|---|---|---|
| 9 | 0 | 10 | 10 |
| 9 | 4 | 50 | 55 |
| 9 | 9 | 100 | 100 |
¶ Output Column Descriptions:
| Column | Description |
|---|---|
| NTotMinus1_C1 | Total number of rows minus one (N-1). |
| NCumulQuantile_C1 | Cumulative number of rows within each quantile. |
| Quantile_C1 | Quantile values based on specified number of tiles. |
| QuantileInterpolated_C1 | Interpolated values for more precise quantile boundaries (if applicable). |
Notes
- Quantiles divide the dataset into equally sized groups based on data distribution.
- Interpolated quantiles provide smoother results for datasets with fewer unique values.
¶ Screenshot of Settings Panel:
¶ Best Practices:
- For large datasets, enable Clever Quantile computation to improve performance.
- Use partitioning only when separate quantiles are required per group.