¶ Description
Create a action plot.
¶ Parameters
¶ Parameters tab
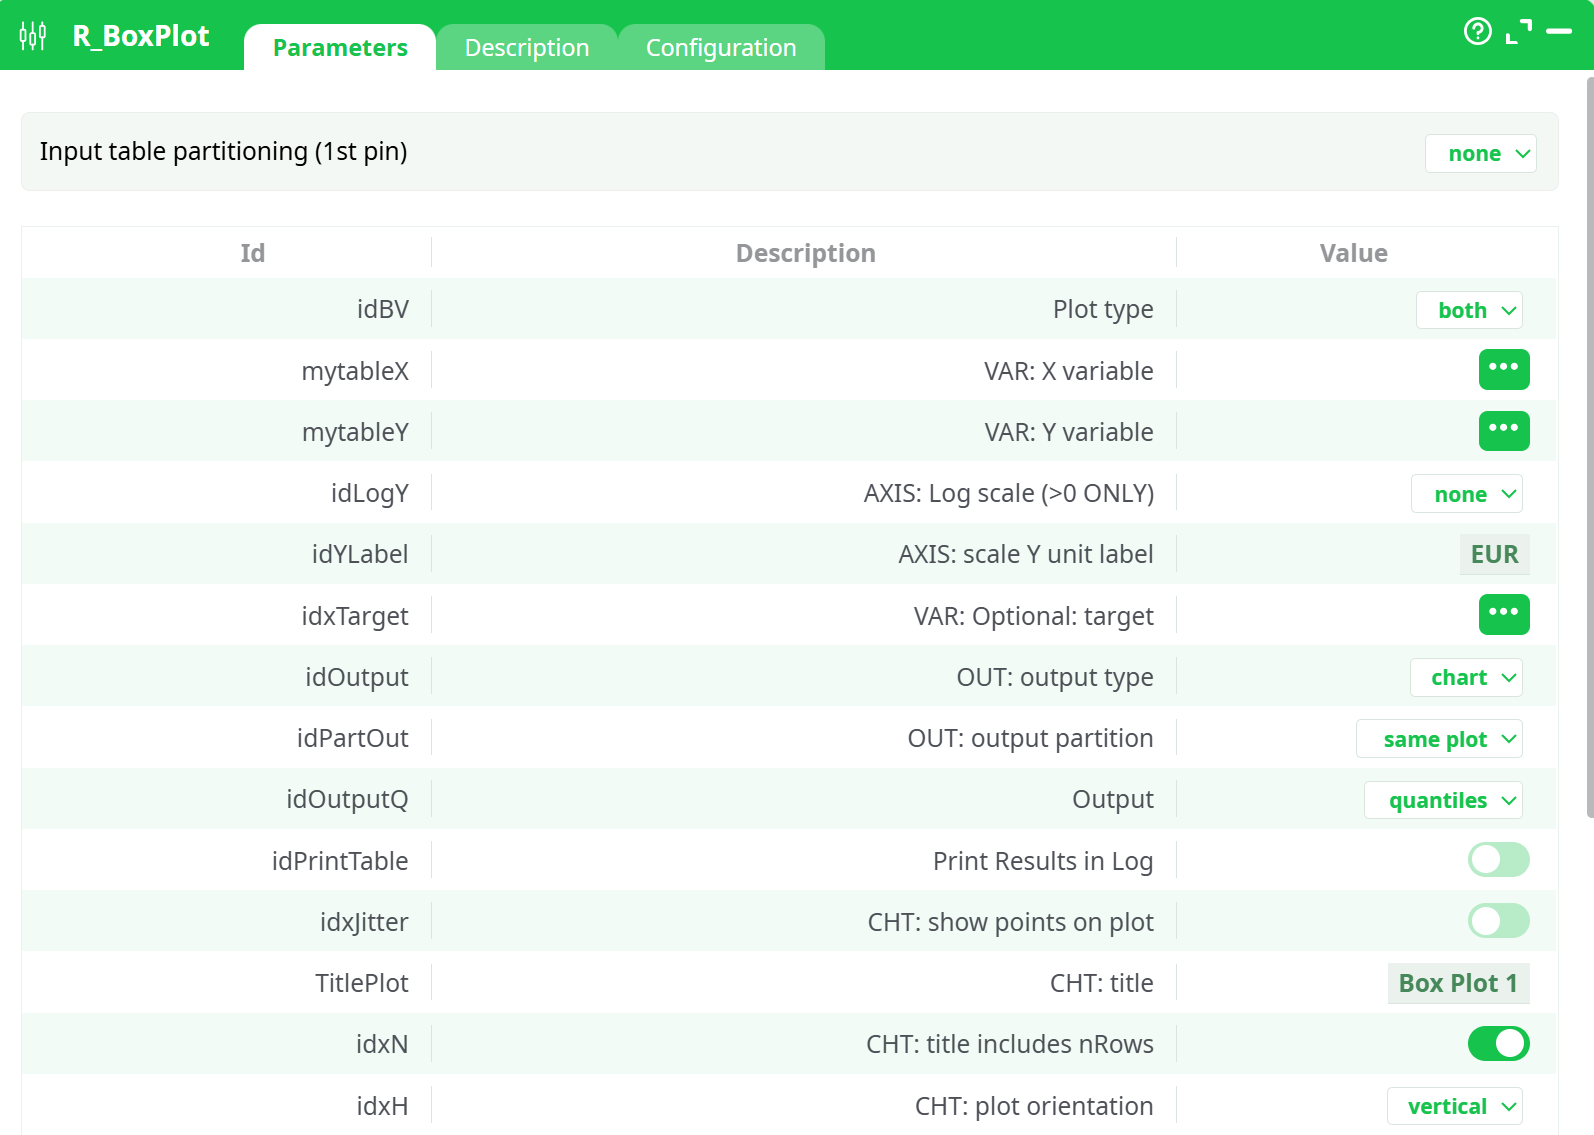
Parameters:
- Input table partitioning (1st pin)
- Partitioning column
- Plot type
- VAR: X variable
- VAR: Y variable
- AXIS: Log scale (>0 ONLY)
- AXIS: scale Y unit label
- VAR: optional target
- OUT: output type
- CHT: show points on plot
- CHT: title
- CHT: title includes nRows
- CHT: plot orientation
- CHT: outlier color
- CHT: action color
- CHT: number of cuts on Y scale
- LBL: X label angle
- LBL: X label alignment
- Output
- Print Results in Log
¶ Description tab
Parameters:
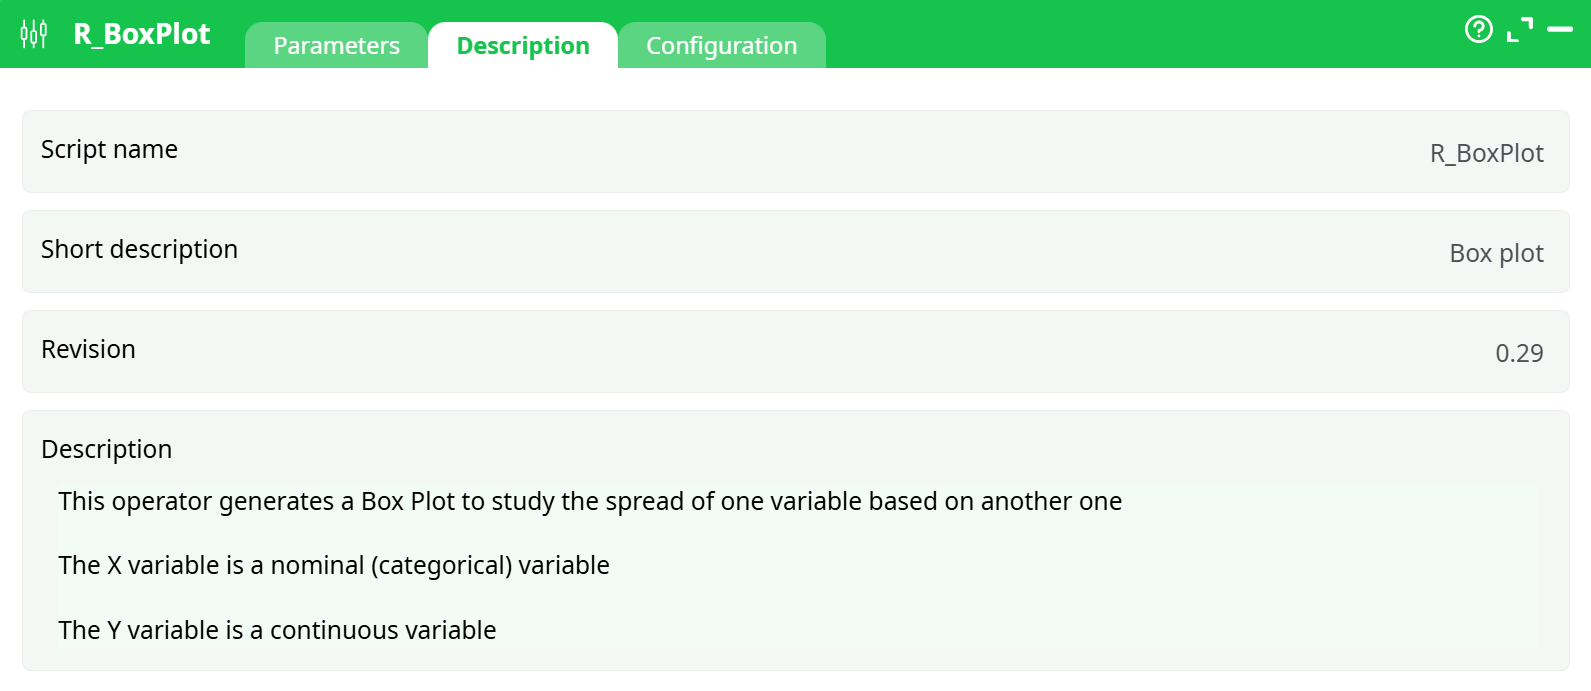
- Script name
- Short description
- Revision
- Description
¶ About
R_BoxPlot makes quick, publication-ready distribution graphics from a single table: a box plot, a violin plot, or both overlaid. It expects a categorical X (groups/buckets) and a continuous Y (the numeric measure you want to inspect). Under the hood it computes quartiles, whiskers (1.5×IQR rule), optional outliers and/or jittered points, and—when asked—an interactive HTML you can hover and zoom through. Titles, label units, widths/heights, log-scales, colors and output formats are all configurable, and you can facet/partition outputs without duplicating the box.
¶ When to use it
- Compare the spread of a metric across categories (e.g., satisfaction by segment, latency by region).
- Spot skew/outliers quickly.
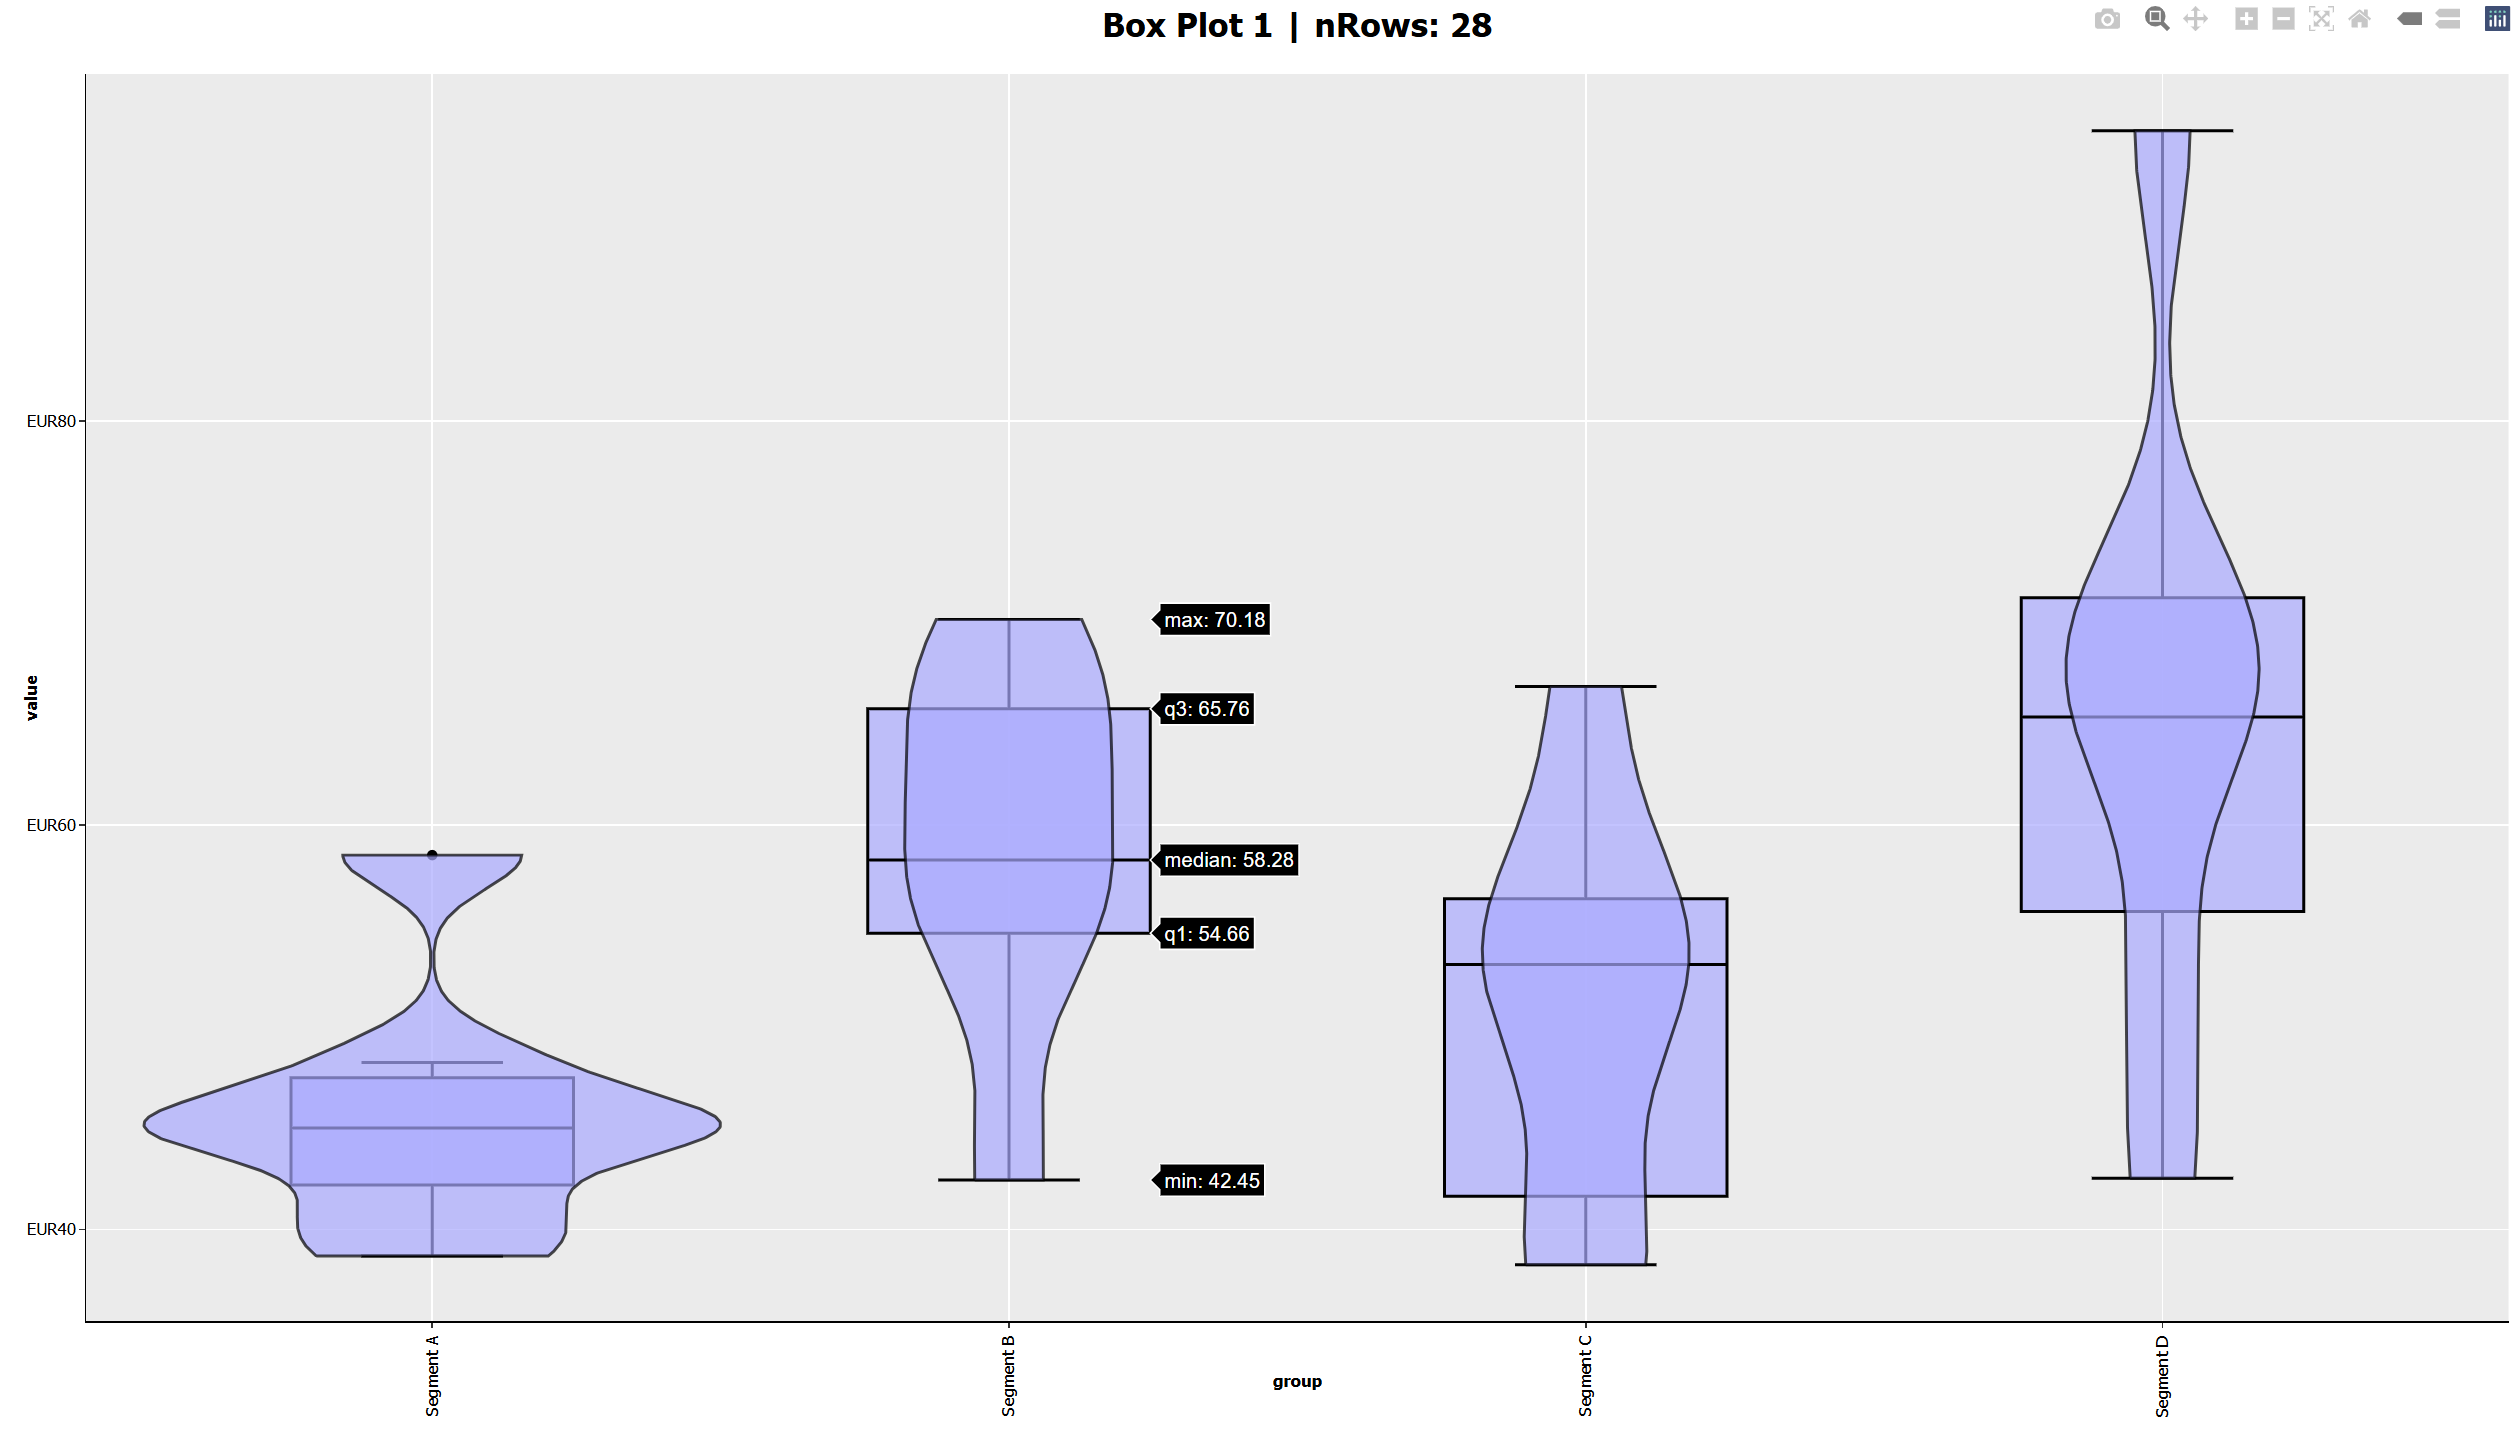
- Share an interactive chart that readers can inspect (hover tooltips show min, Q1, median, Q3, and max).
- Produce one plot per partition or write several files in a single run.
¶ How it works (conceptually)
-
You provide a table with at least two columns: X (categorical) and Y (numeric).
-
The operator groups rows by X and computes the five-number summary for Y (min, Q1, median, Q3, max) plus whiskers.
-
Depending on Plot type, it draws:
- box: classical box-and-whisker (optional outlier and jitter marks).
- violin: kernel density “violin” silhouette.
- both: violin filled in the back + box overlay for precise quartiles.
-
It renders to the chosen Output type (chart/HTML/interactive HTML) and saves files to Records; optionally emits summary values.
¶ Inputs & basic requirements
- X variable: categorical (text, or numeric treated as categories).
- Y variable: numeric/continuous.
- Optional target: an extra variable for sub-partitioning or layering (e.g., split outputs by target, or use upstream partitioning).
- Works with upstream partitioning (“Input table partitioning” control) if you need one plot per slice of the data.
¶ Key parameters (in plain language)
¶ Plot design
- Plot type (
idBV) – choosebox,violin, orboth(overlay). - VAR: X variable (
mytableX) – pick the grouping column. - VAR: Y variable (
mytableY) – pick the numeric measure to summarize. - AXIS: Log scale (
idLogY) –noneorLog10. Only use when Y>0 for all rows. - AXIS: scale Y unit label (
idYLabel) – a unit suffix on the Y axis (e.g.,EUR,ms,%). - CHT: plot orientation (
idxH) –vertical(categories on X) orhorizontal(categories on Y). - CHT: show points on plot (
idxJitter) – overlay jittered dots to see individual observations. - CHT: outlier color / box color (
cOutlier,cBox) – tweak highlight and box stroke/fill. - CHT: number of cuts on Y axis (
nCut) – major tick density. - LBL: X label angle / size / alignment (
Xangle,idFS,idAlign) – improve long category label readability. - CHT: title (
TitlePlot) + title includes nRows (idxN) – add a title and optionally show “nRows: N”.
¶ Output & partitioning
-
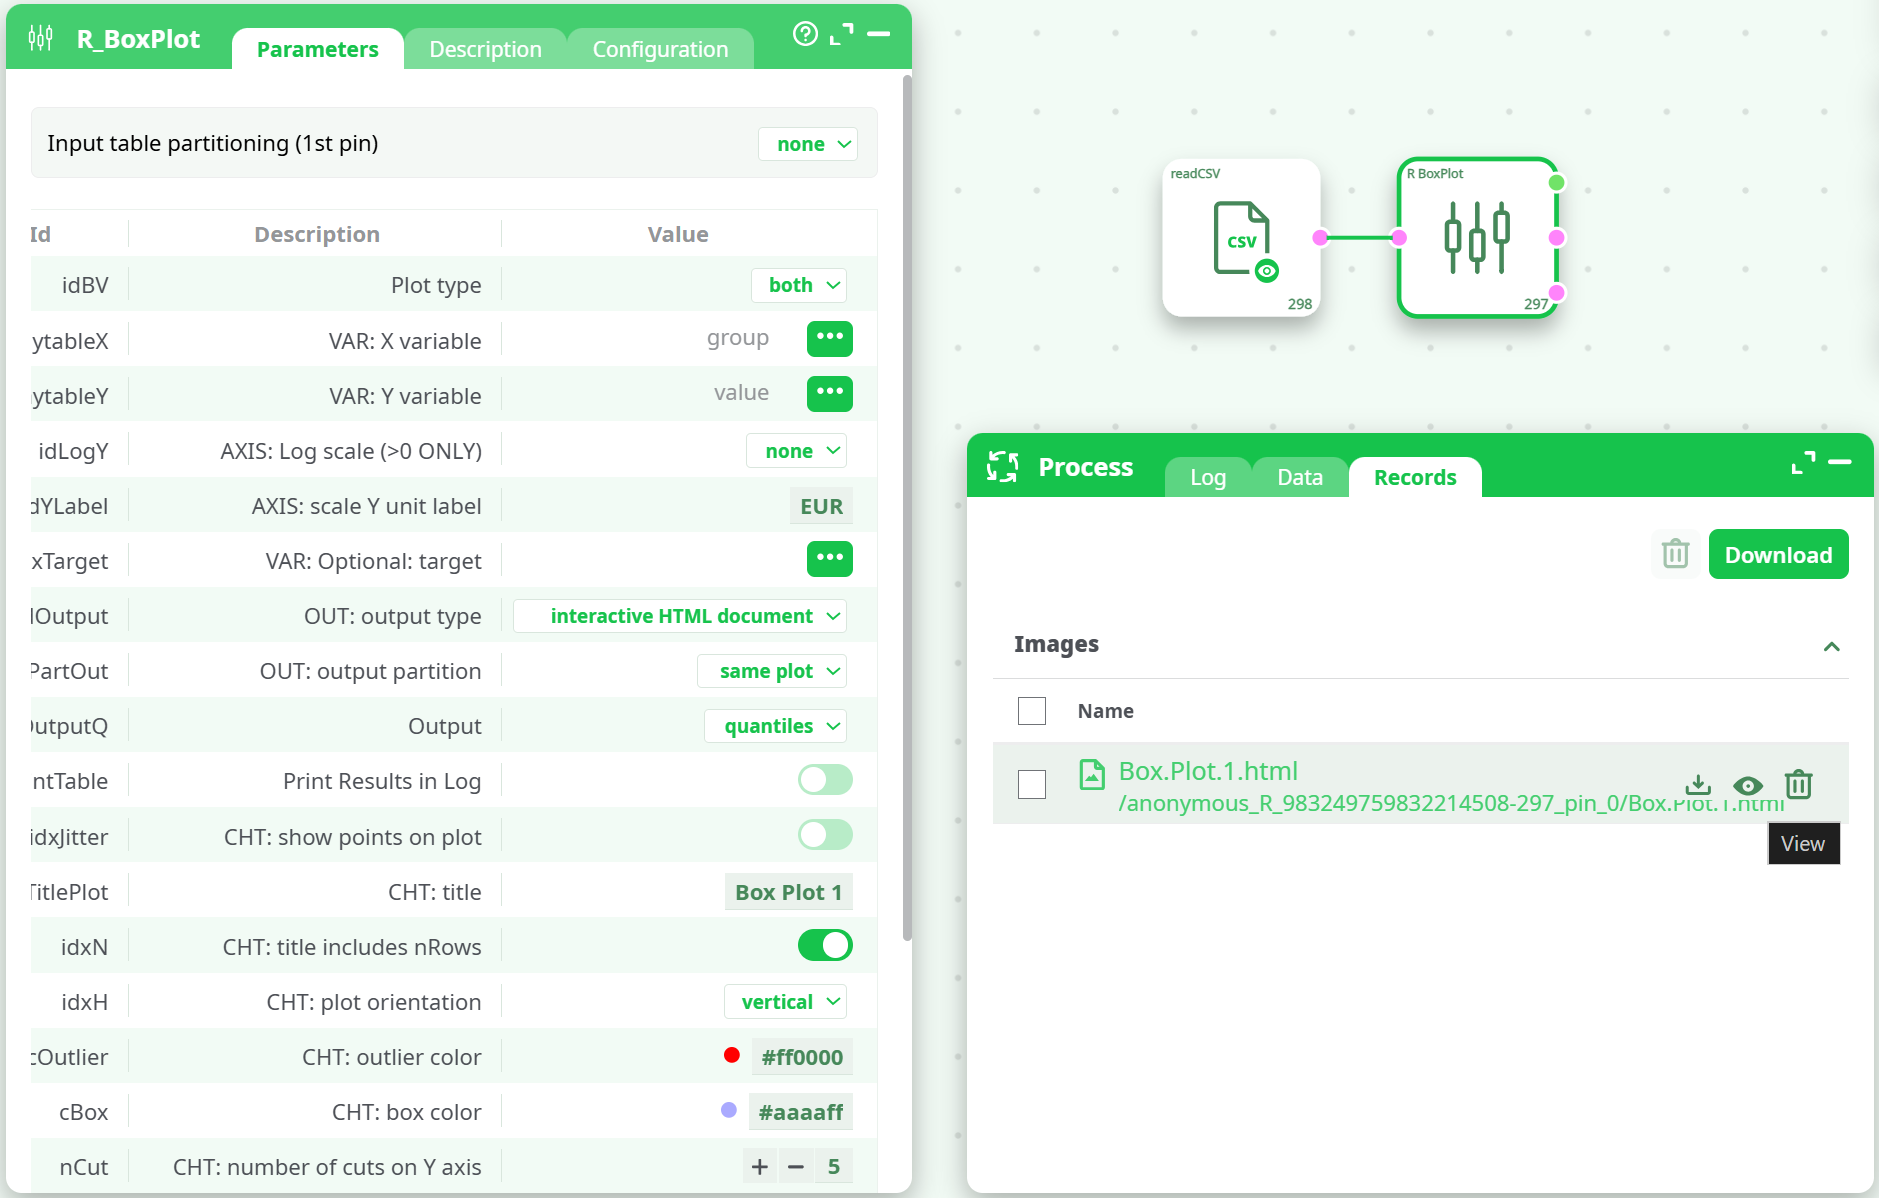
OUT: output type (
idOutput)chart– static chart file (image).HTML document– static HTML.interactive HTML document– zoom/hover tooltips out of the box.
-
OUT: output partition (
idPartOut)same plot– everything in one figure/file (default).different files– one file per category/partition.
-
Output (
idOutputQ)quantiles– also produce five-number summary (and enrich interactive tooltips).nothing– draw only the chart.
¶ Layout & rendering
- Image resolution (
myDpi) – DPI used for raster charts. - Width / Height (
idW,idH) – physical size of the output (cm). - Color Palette (
cPalette) – choose a ggplot palette when multiple layers/groups are present. - VAR: Optional: target (
idxTarget) – use to drive layered aesthetics or to split/facet when combined with output partitioning or upstream partitioning.
¶ Outputs
-
Records tab: one or more files depending on
idPartOutand upstream partitions.- For interactive HTML, readers can pan/zoom and hover to view min, Q1, median, Q3, max and whiskers for each group.
-
Data / Log (optional): if
idOutputQ = quantiles, the operator also exposes summary stats for downstream auditing; andidPrintTablecan print them in the log.
¶ Partitioning strategies
- Inside the box:
idPartOut = different filesemits one file per X level (or peridxTarget/partition). - Upstream: if the input is already partitioned by another column (or by the pipeline’s partitioner), R_BoxPlot will run once per slice—helpful for “one report per client/region”.
¶ Tips & good practices
- Validate types: if the Y column isn’t numeric, convert it upstream. If you enable
Log10, ensure Y>0 for all rows. - Clean categories: too many X levels makes the plot hard to read; group rare categories or sort them upstream.
- Orientation: switch to horizontal when category labels are long; otherwise rotate labels with
Xangle. - Outliers vs jitter: enable jitter to see all points (dense groups), or rely on outliers to highlight extremes.
- Interactive HTML: best for sharing and quick exploration; static
chartis ideal for embedding in PDFs. - Sizing: adjust
idW/idHandmyDpito fit dashboards or slide decks without blurry text.
¶ Troubleshooting
- Blank/failed plot – Usually due to non-numeric Y or empty groups after upstream filters. Check the Log tab.
- “Log scale” errors – Remove zeros/negatives or switch
idLogYtonone. - Labels overlap – Increase
idW, rotate labels (Xangle), or usehorizontalorientation. - No file in Records – Ensure
idOutputisn’t set to a data-only mode, and thatidPartOutisn’t pointing to empty partitions. - Too many files – Switch
idPartOuttosame plot, or reduce upstream partitions.