¶ Description
Generates a cloud of words based on text data.
¶ Parameters
¶ Parameters tab

Parameters:
- Input table partitioning (1st pin)
- Text column
- Count column
- Max words
- Ignore words with counts lower than
- Percentage of rotated word
- Color palette
¶ Description tab
Parameters:
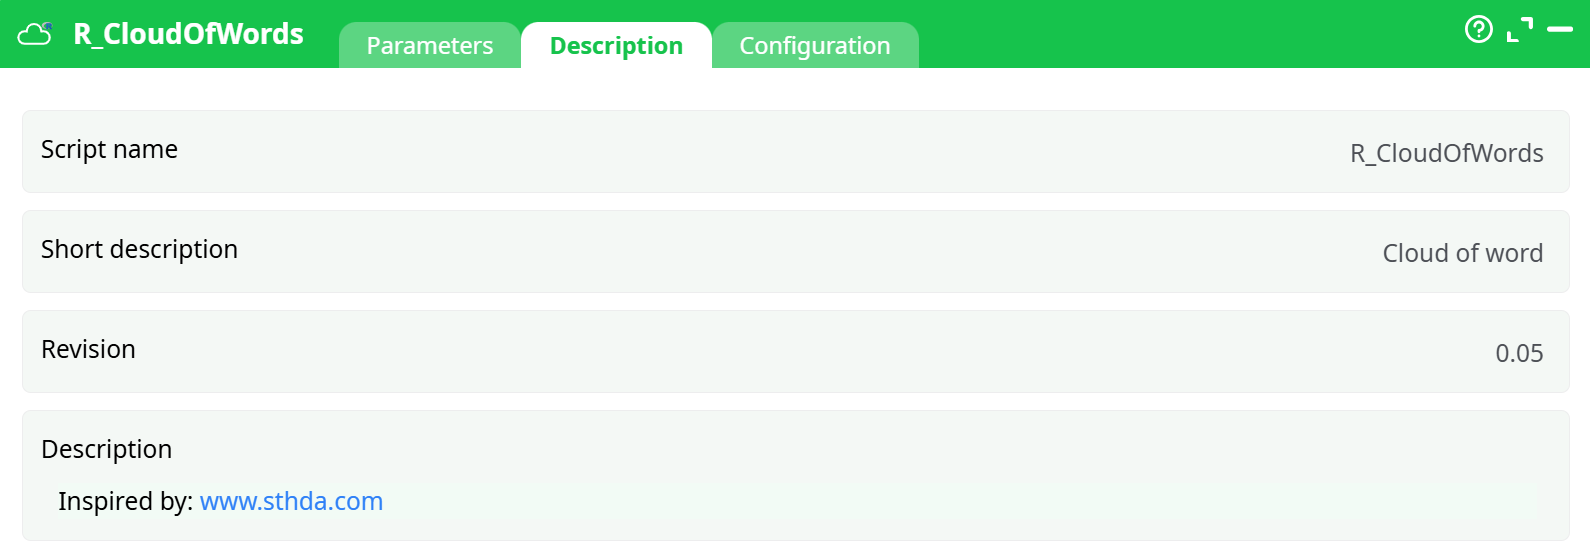
- Script name
- Short description
- Revision
- Description
¶ Configuration tab
See dedicated page for more information.
¶ About
Generates a cloud of words based on text data.
- Text Column: the column with the word information
- Count Column: the column with the frequency of occurrence of the word
- Max Words: Maximim of different words to display
- Ignore words with counts lower than: min threshold to display in the chart
- Percentage of rotated words: percentage of words that will be displayed vertically
- Color Palette: choose color scheme.
There are two ways of using this visualization:
- Generate account of occurrence of preset text
- Generate a count of occurrence of words in open text.
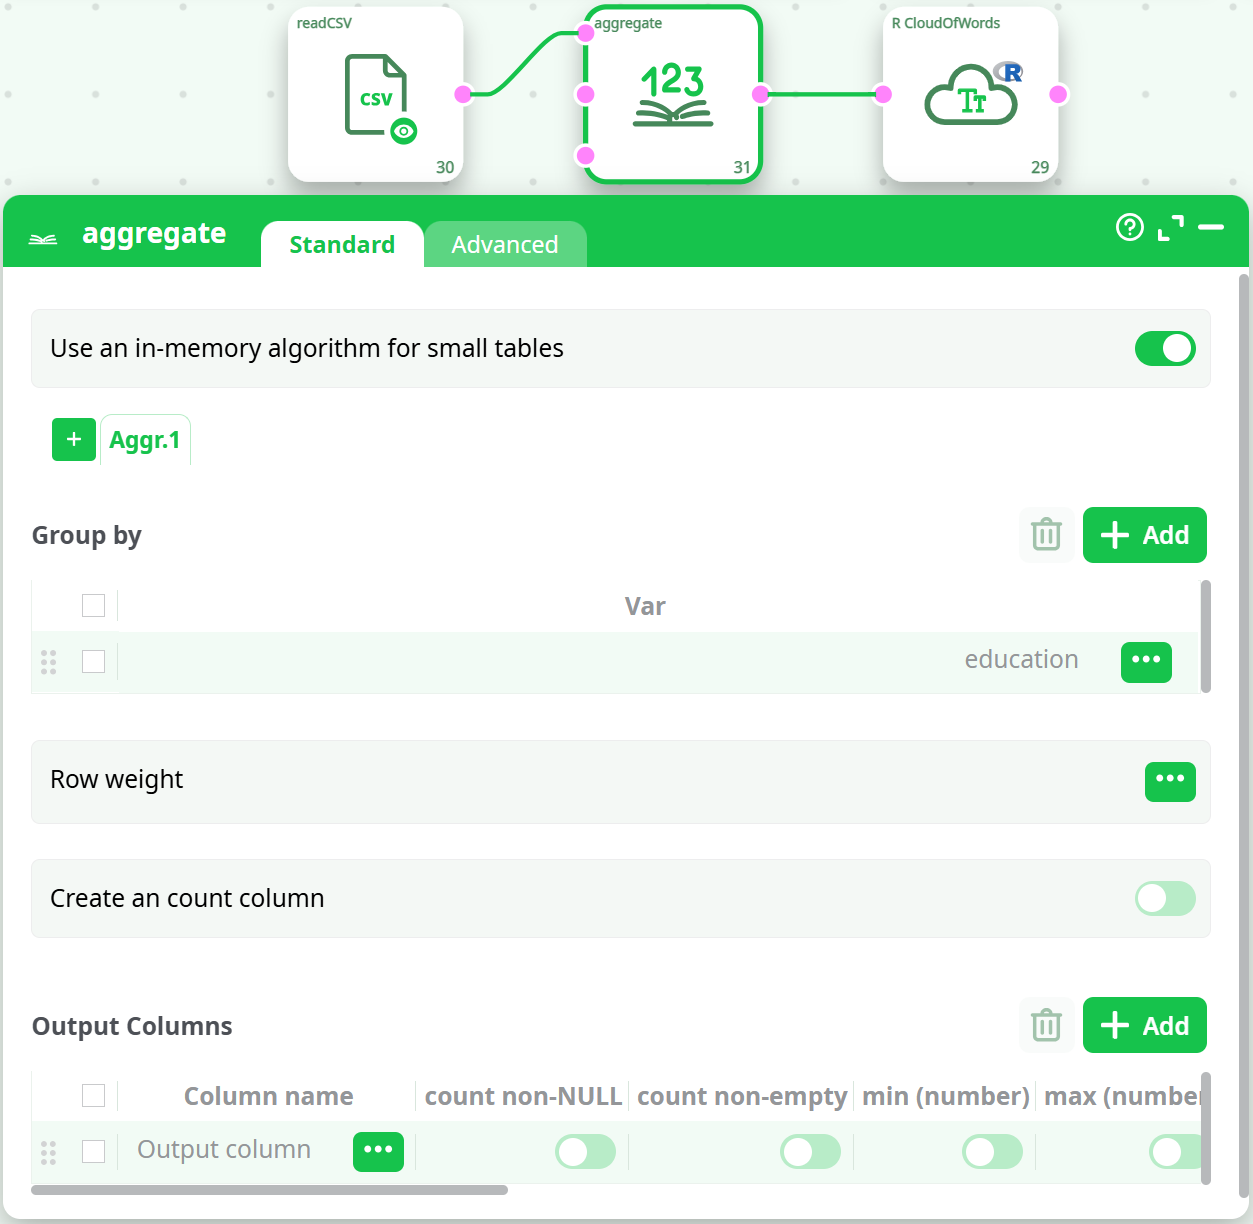
The first one is straight forward: simply use an aggregate and extract the count, for example, let’s explore the education level in the Census Income database a bit differently. We simply use Aggregate on Education, and select the Count
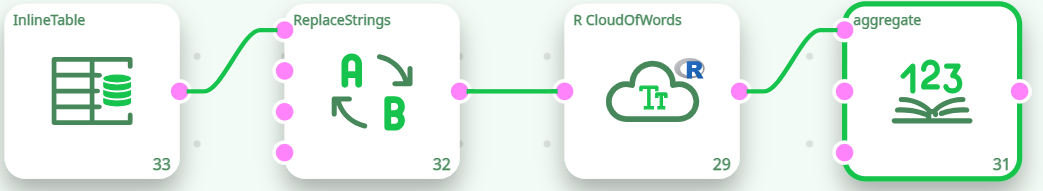
The second way require generating data for the cloud of word from a text. Let’s explore a star wars review form December 21, 2018 (http://www.trustedreviews.com/opinion/star-wars-the-last-jedi-spoilers-ending-3356585):
First, we “normalize” our text data (set all to lower case, remove punctuation, remove accents), and we use the CloudofWord action from “Text Mining”, we then aggregate the data and send to the R Cloud of Word action: