¶ Description
Show classification tables for models.
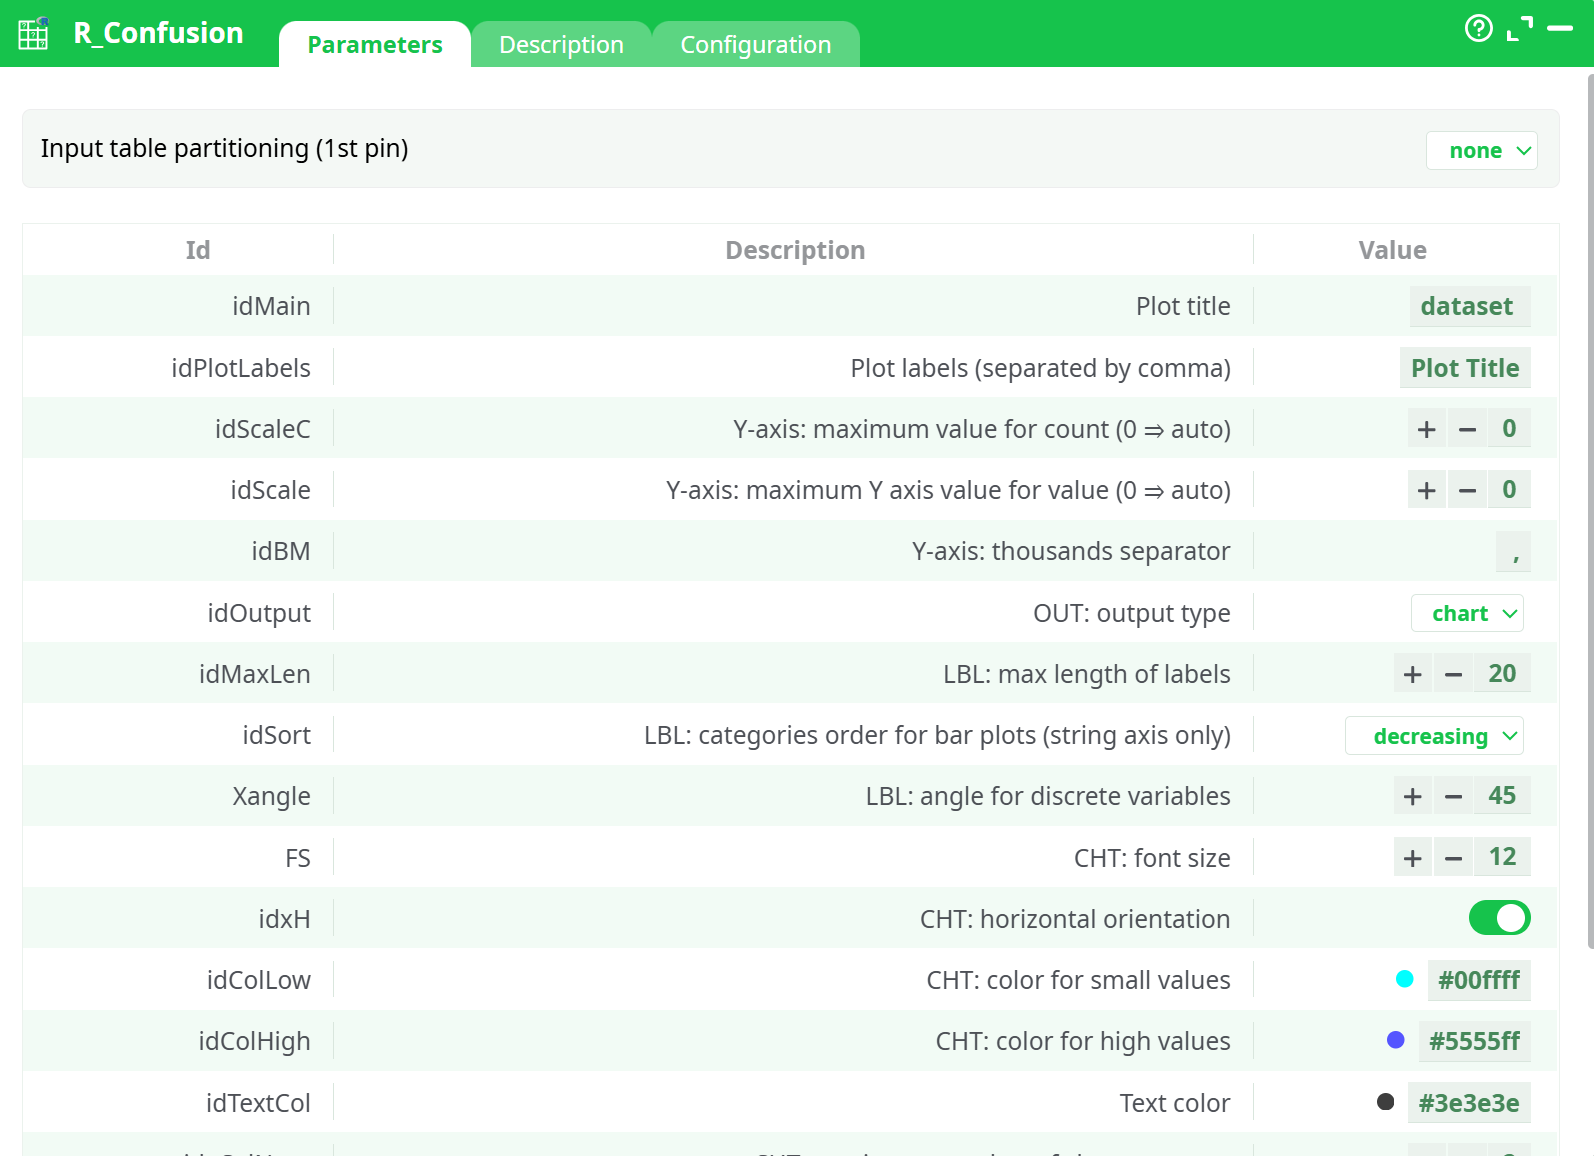
¶ Parameters
¶ Parameters tab
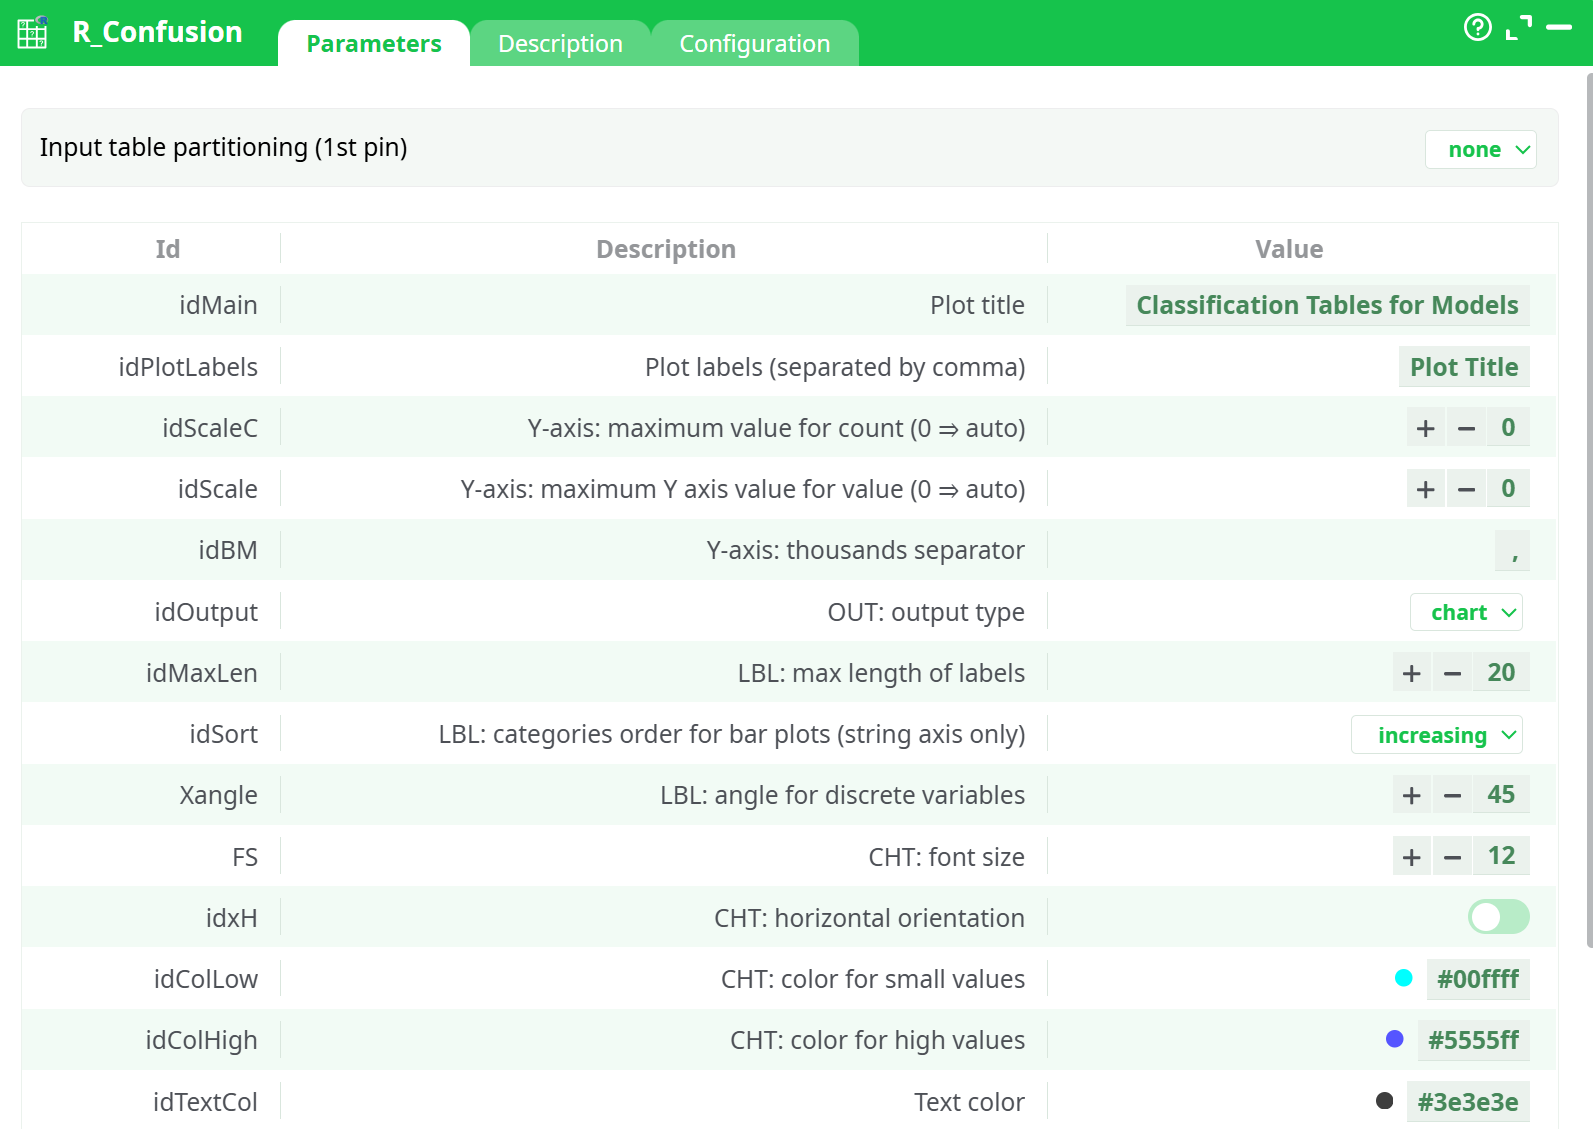
Parameters:
- Input table partitioning (1st pin)
- Plot title
- Plot labels (separated by comma)
- Y axis: maximum value for count (0=auto)
- Y axis:maximum y axis value for value (0=auto)
- Y axis: thousands separator
- Out: output type
- Lbl: max length of labels
- Lbl: categories order for bar plots (string axis only)
- Lbl: angle for discrete variables
- Cht: font size
- Cht: orientation horizontal?
- Cht: color for small values
- Cht: color for high values
- Text color
- Cht: maximum number of charts per row
- Cht: chart margin
- Img: multiplot png width (pixel)
- Img: multiplot png height (pixel
¶ Description tab
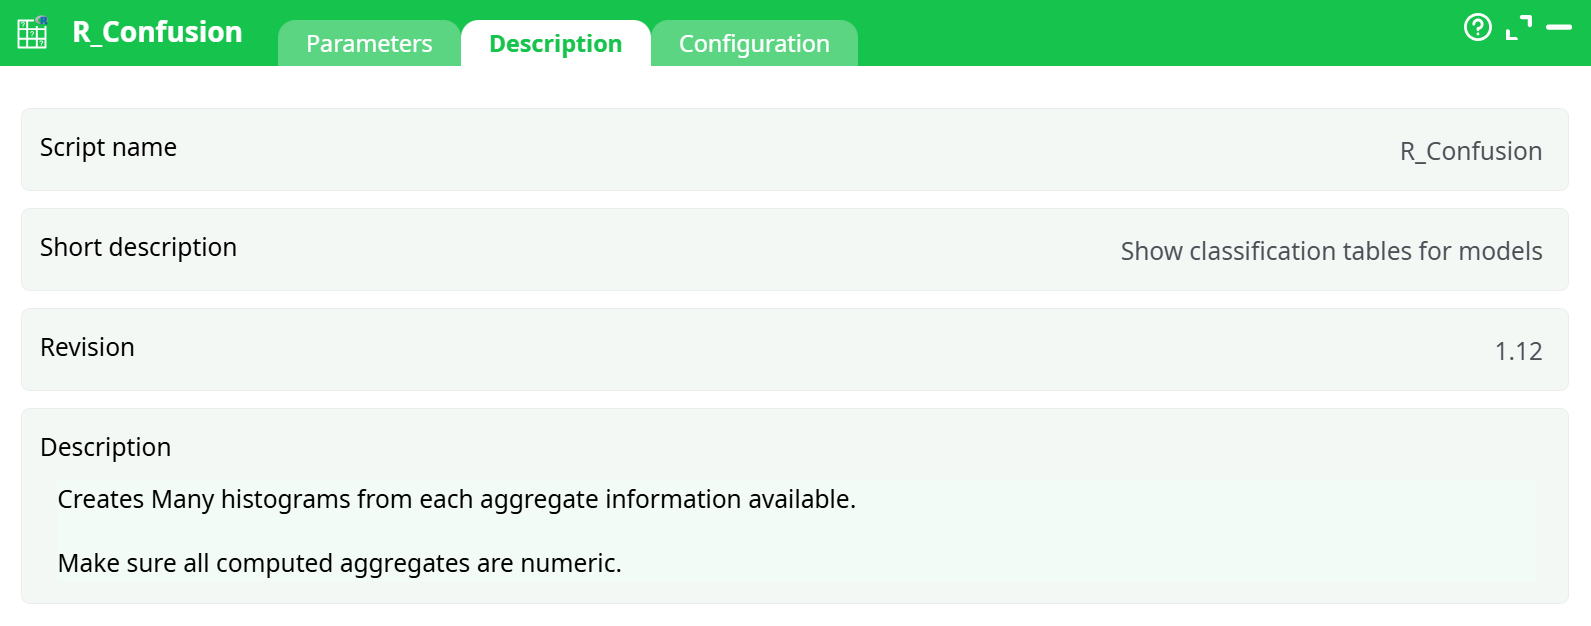
Parameters:
- Script name
- Short description
- Revision
- Description
¶ Configuration tab
See dedicated page for more information.
¶ About
The R Confusion action button visualizes classification performance using a confusion matrix based on aggregated prediction results. It helps measure the accuracy of classification models by comparing actual vs. predicted values, and produces a visual chart with per-class accuracy percentages.
¶ Input
-
Input Type: CSV or table with aggregated class predictions
-
Required Columns:
Actual: Ground truth class labelPredicted: Predicted class labelValue: Count of occurrences (numeric only)
-
Accepted Format: UTF-8 CSV file with headers
-
Important: Make sure the
Valuecolumn contains valid numeric data. ColumnsActualandPredictedmust contain valid, consistent string labels.
Example Input Table:
| Actual | Predicted | Value |
|---|---|---|
| cat | cat | 15 |
| cat | dog | 3 |
| dog | dog | 12 |
| dog | cat | 5 |
| rabbit | rabbit | 10 |
| rabbit | dog | 2 |
File used: confusion_matrix_input.csv
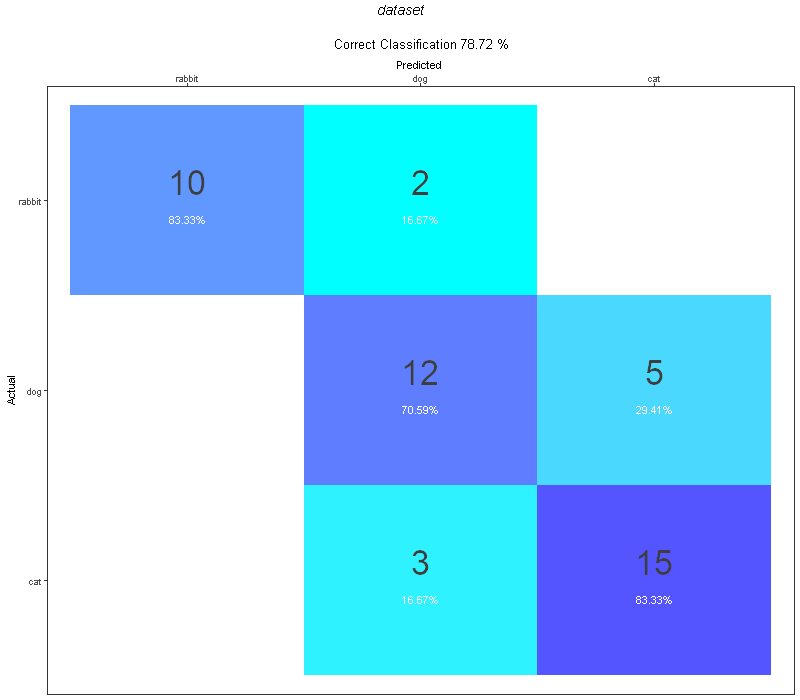
¶ Output
-
Confusion Matrix Image (
ActualPredicted.png)
A square matrix showing Actual vs. Predicted class distribution, with counts and class-wise accuracy. -
Accuracy Metric
Printed above the matrix (e.g.,Correct Classification 78.72%) -
Behavior with
idOutput:
WhetherHTML document,Image, orchartis selected — the same PNG file is generated.
Example Output Image:
¶ How to Run
-
Prepare Input File
UsereadCSVto load a properly structured CSV withActual,Predicted, andValue. -
Link the Action Button
Connect the file to theR Confusionaction. -
Set Parameters
- Title, color scheme, sort order, orientation, font size, etc.
- Choose output type (
HTML documentorImage) — both generate a.pngfile.
-
Run the Pipeline
AddRunToFinishLineand execute. -
View Results
- Go to
Recordsto download/view the image. - View the
Logtab for summary and debug information.
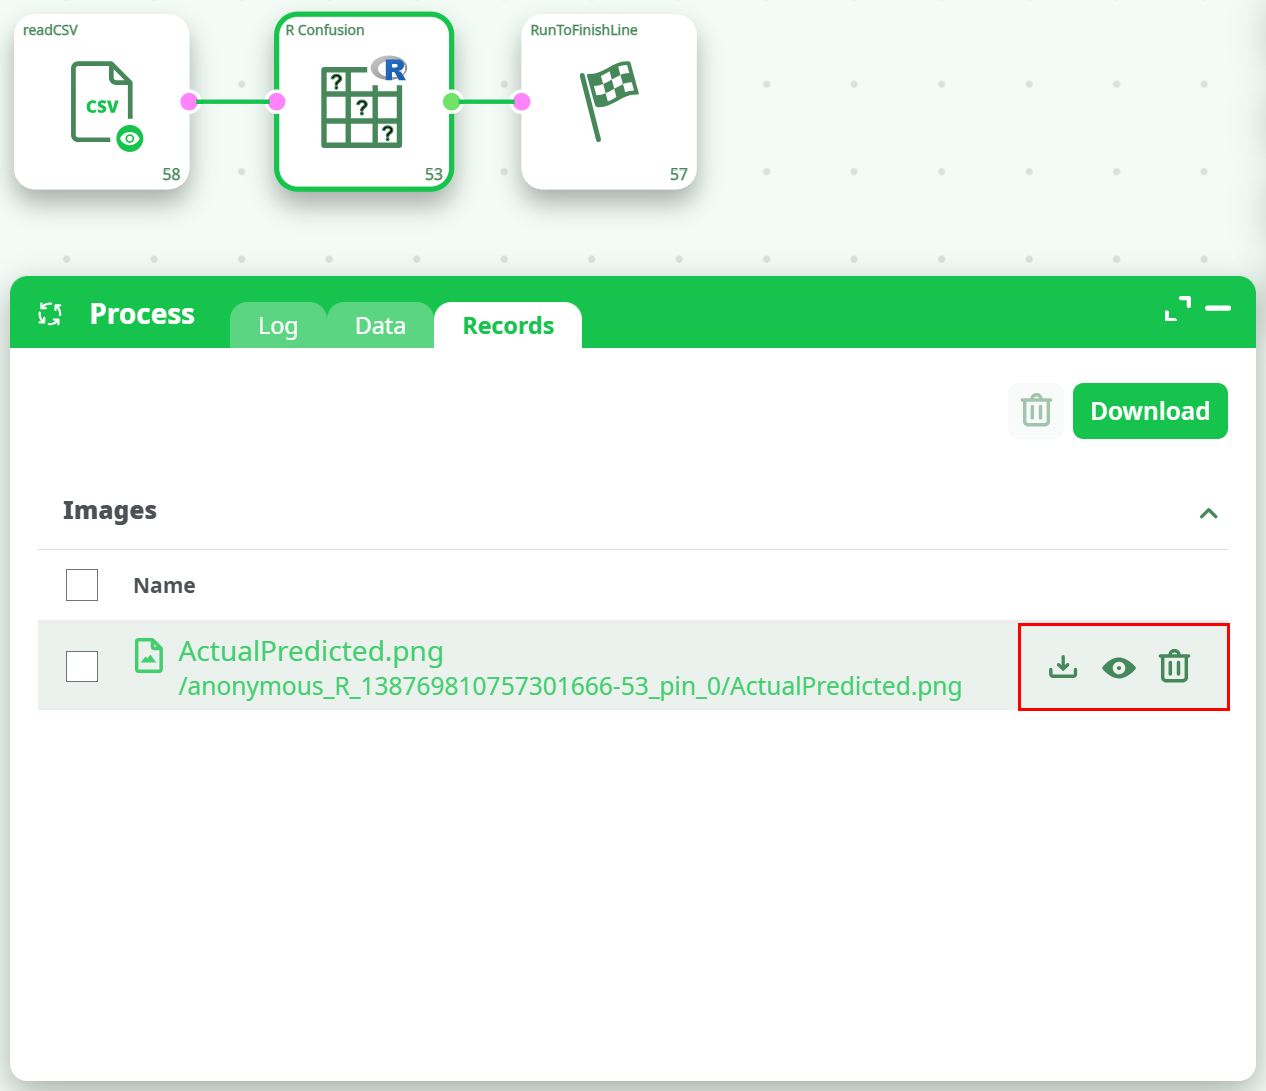
- Go to
¶ Example
Input File: confusion_matrix_input.csv
Output Chart:
Correct Classification: 78.72%
¶ Use Cases
-
Machine Learning Evaluation
After predicting labels with a classification model, use this to visualize confusion matrix results. -
ETL Model Diagnostics
Monitor how classification models behave when integrated into automated pipelines. -
Performance Reporting
Export images as visual artifacts for reports or dashboards.
¶ Troubleshooting & Common Errors
¶ Error in dev.off(): cannot shut down device 1 (the null device)
Cause: R plot failed to close — likely due to empty/malformed input or no matching factors.
Fix: Ensure input has valid Actual/Predicted values with numeric counts. Avoid empty inputs.
¶ '-' not meaningful for factors
Cause: The input contains unexpected values such as "-" or missing labels that are interpreted as factor types.
Fix: Clean the input file; remove or replace any invalid or placeholder strings.
¶ ggplot2 or plotly version warnings
Note: These are warnings only. They appear when the R packages are from a different version but usually don't break the output.
¶ Authorization required, but no authorization protocol specified
Cause: Pipeline ran in an environment requiring authentication.
Fix: Ensure your session or environment is properly authorized.
¶ Tips
- Avoid hyphens or null values in class labels
- Keep label lengths under the max limit to avoid cutoff
- Even if you choose HTML or chart as output, only one
.pngfile will be generated - Use contrasting
idColLowandidColHighfor better visualization