¶ Description
Display a correlation matrix.
¶ Parameters
¶ Parameters tab
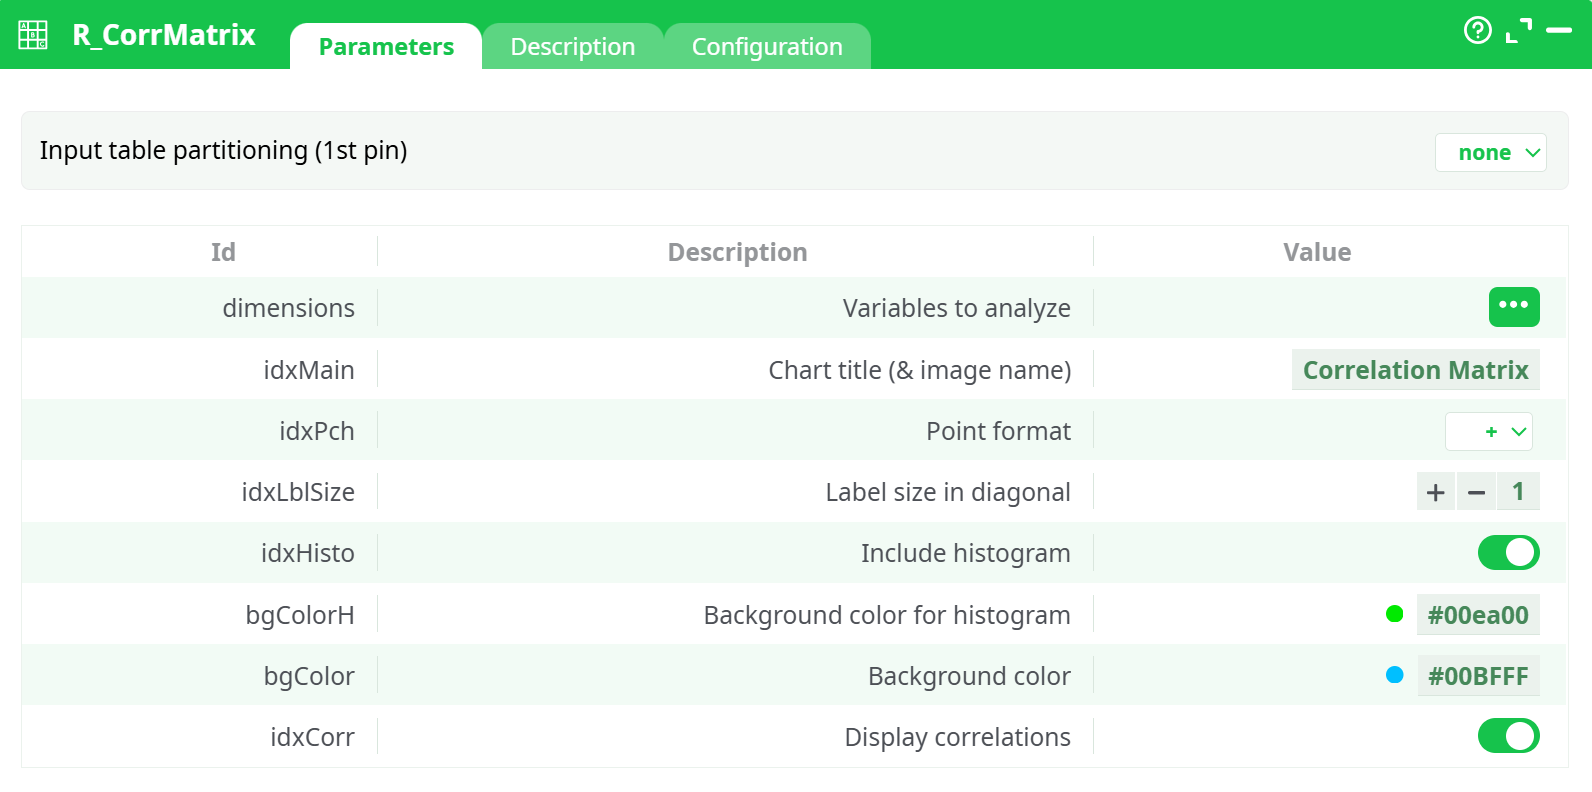
Parameters:
- Variables to analyze
- Chart title (name of png)
- Point format
- Label size in diagonal
- Include histogram
- Background color for histogram
- Background color
- Display correlations
¶ Description tab
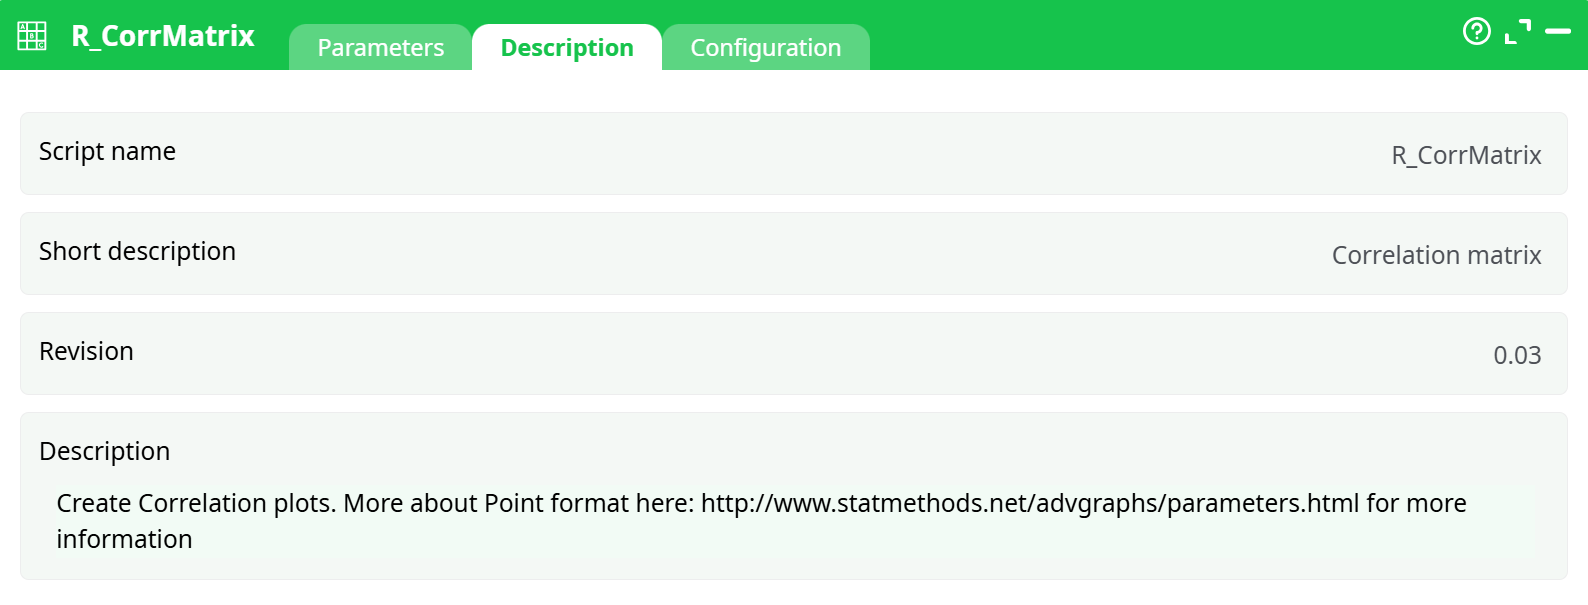
Parameters:
- Script name
- Short description
- Revision
- Description
¶ Configuration tab
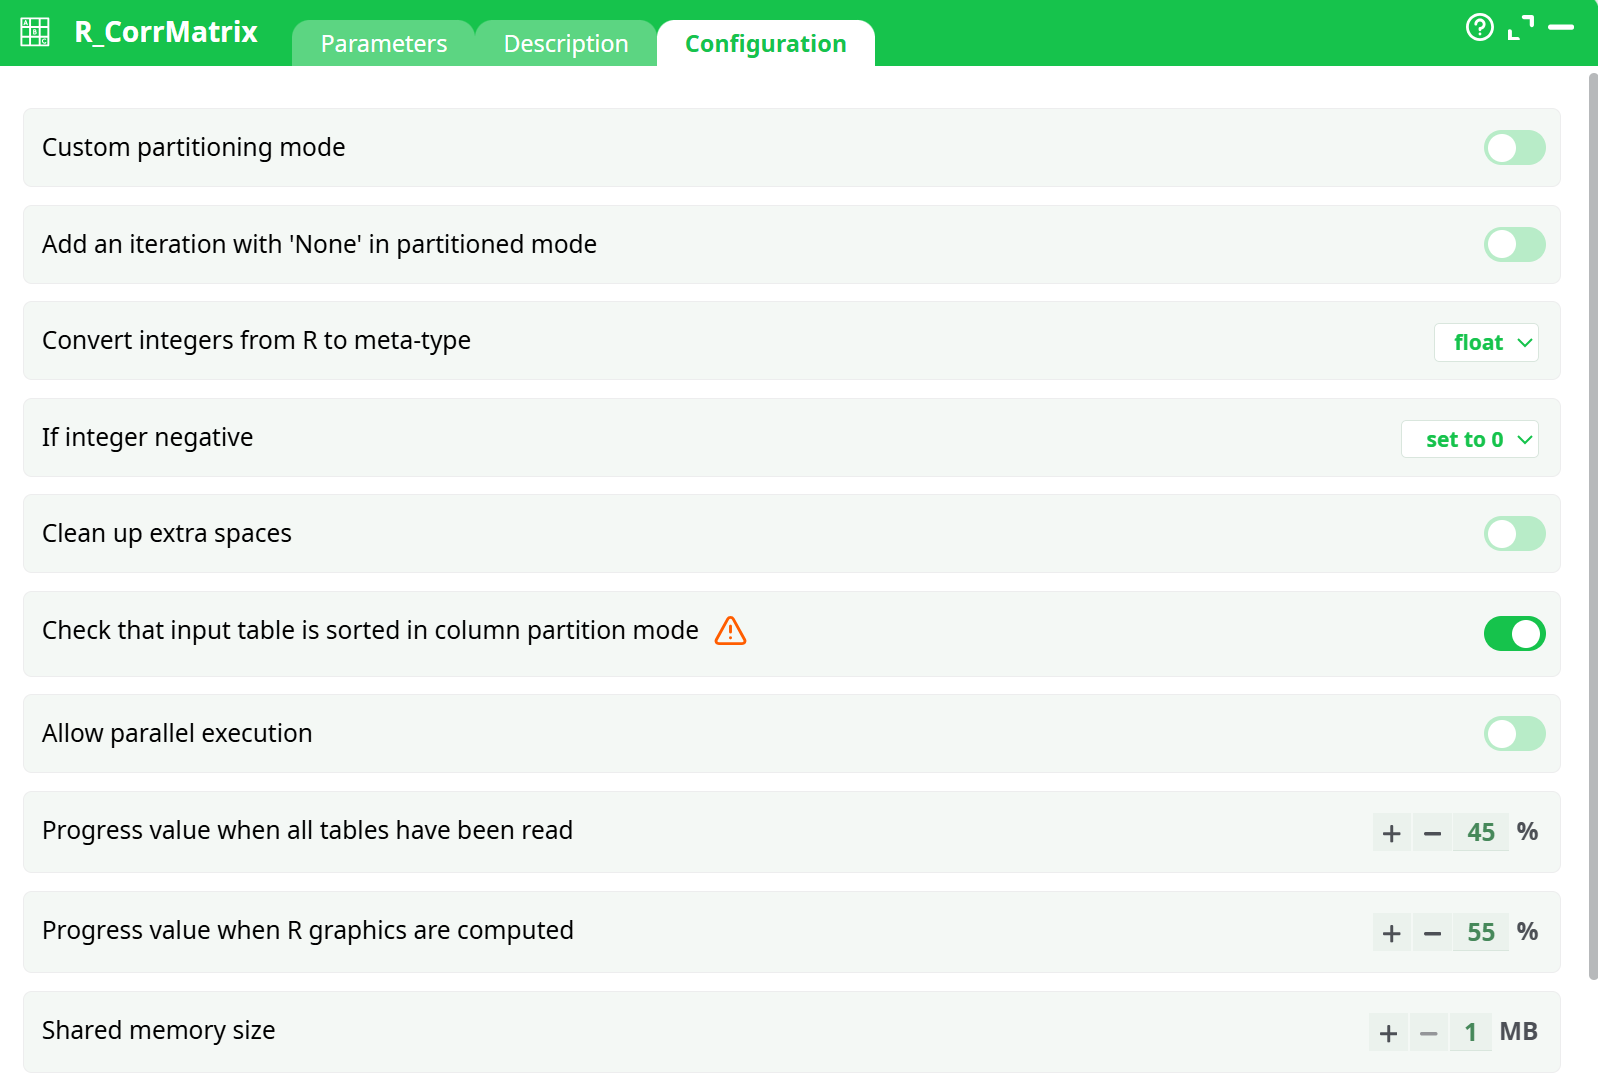
Parameters:
- Convert float to key
- If negative
- If greater than 2^32-3
- If not an integer
- Convert string to float
- if not a number
- Convert 'unknown/string' to key
- if not a number
- if negative
- if greater than 2^32-3
- if not an integer
- Additional JavaScript libraries
- Input pins
- Variable number
- Default inputs number
- Minimum
- Maximum
- Output pins
- Variable number
- Default outputs number
- Minimum
- Maximum
- If column missing
¶ About
The R_CorrMatrix action button generates a Correlation Matrix visualization from selected numeric variables in the input dataset. This tool is especially useful for analyzing linear relationships between multiple features and for visually detecting multicollinearity or strong associations within a dataset.
¶ Overview
The Correlation Matrix displays pairwise correlation coefficients (Pearson by default) between numeric variables. In addition to the correlation grid, the action can enrich the visualization with histograms on the diagonal and numeric correlation values inside each cell. This helps analysts quickly assess the strength and direction of relationships between variables.
When executed, the action produces an image (e.g., PNG/HTML plot) rather than a tabular dataset. However, the downstream pin of this component will expose a status column, which indicates the process completion state and allows chaining with subsequent actions in the pipeline.
¶ Key Features
-
Multiple Variables Analysis: Select multiple numeric columns (e.g.,
Height,Weight,Age,Score) to evaluate relationships simultaneously. -
Customizable Appearance:
- Adjustable point format and label size on the diagonal.
- Optional histograms on the diagonal, with customizable background color.
- Configurable background color of the chart for better readability.
-
Correlation Display: Toggle correlation values directly in the plot cells.
-
Flexible Output: Generates a visual correlation matrix as an output image and passes a process status column (
status) downstream for workflow continuity.
¶ Typical Workflow
-
Input Data: Provide a dataset containing numeric variables of interest.
-
Parameter Setup:
- Select Variables to analyze.
- Define the Chart title (this also becomes the output image filename).
- Adjust optional visual settings (point format, label size, histogram inclusion, background colors, correlation values).
-
Execution:
- The component runs in R and computes pairwise correlations.
- A correlation matrix plot is created and saved as an output file.
- The pipeline receives a generated
statuscolumn indicating successful execution.
-
Downstream Usage:
- Other visualization blocks (e.g.,
R_PlotTimeSerie,R_BoxPlot,R_Multiplot) can connect, but will only see thestatuscolumn unless the correlation output file is exported and re-imported.
- Other visualization blocks (e.g.,
¶ Example Use Cases
- Exploratory Data Analysis (EDA): Quickly spot correlations in demographic, financial, or sensor datasets.
- Feature Engineering: Identify redundant variables that may cause multicollinearity in predictive modeling.
- Reporting: Generate visual correlation plots for inclusion in reports or dashboards.
¶ Output
- Visual File: Correlation matrix plot saved to the pipeline output directory.
- Downstream Column: A
statuscolumn is added to confirm action execution, which can be used for pipeline control but does not include the actual correlation values.