¶ Description
Create a Histogram chart.
¶ Parameters
¶ Parameters tab
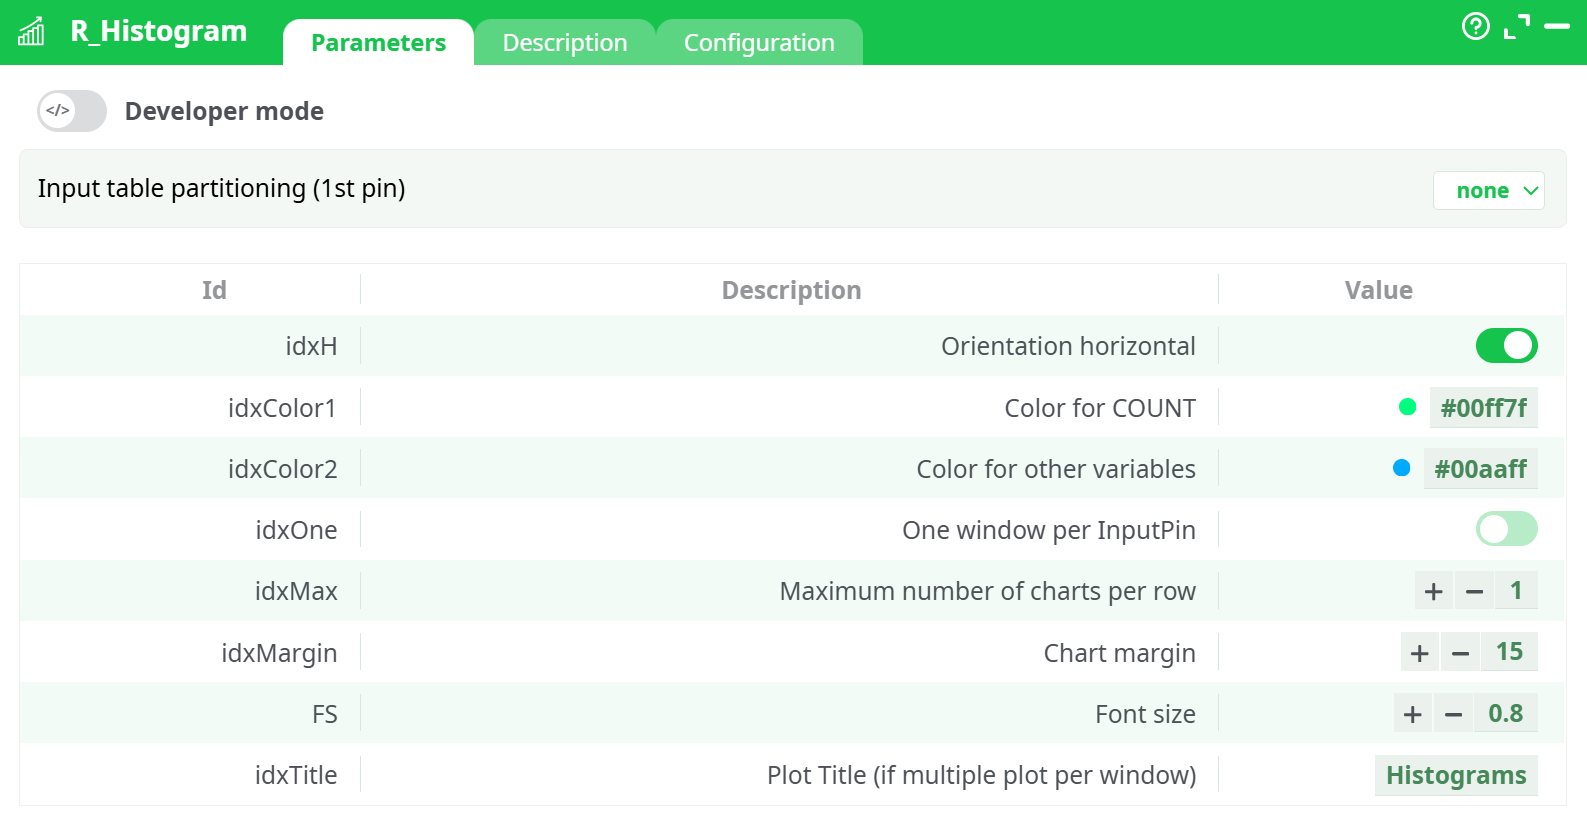
Parameters:
- Developer mode: activate/deactivate code tab.
- Input table partitioning (1st pin)
- Add button: Add custom parameters
- Trash button: Delete selected parameter(s)
- Orientation horizontal
- Color for COUNT
- Color for other variables
- One window per InputPin
- Maximum number of charts per row
- Char margin
- Font size
¶ Description tab
See dedicated page for more information.
¶ Code tab
R_Histogram is a scripted action. Embedded code is accessible and customizable through this tab.
¶ Configuration tab
See dedicated page for more information.
¶ About
Status: Deprecated
UseR_HistogramGGP2instead for modern, stable usage and better compatibility with headless environments.
¶ Overview
The R_Histogram action button creates multiple histogram plots from already aggregated numeric data. It expects the input data to contain pre-aggregated values, and renders separate histograms for each variable or group present in the dataset.
This component is designed to visualize the distribution of numeric variables using base R graphics. However, due to its reliance on windows() for plot rendering, this action is incompatible with Linux/headless servers, which may result in execution errors.
¶ Known Issues
- Fails in headless environments: Internally uses
windows()graphical device which only works on interactive Windows OS. - Use
R_HistogramGGP2for compatibility with Linux-based ETL platforms.