¶ Description
MDS is a visual data reduction method used to better understand the proximity between records or between variables.
¶ Parameters
¶ Parameters tab
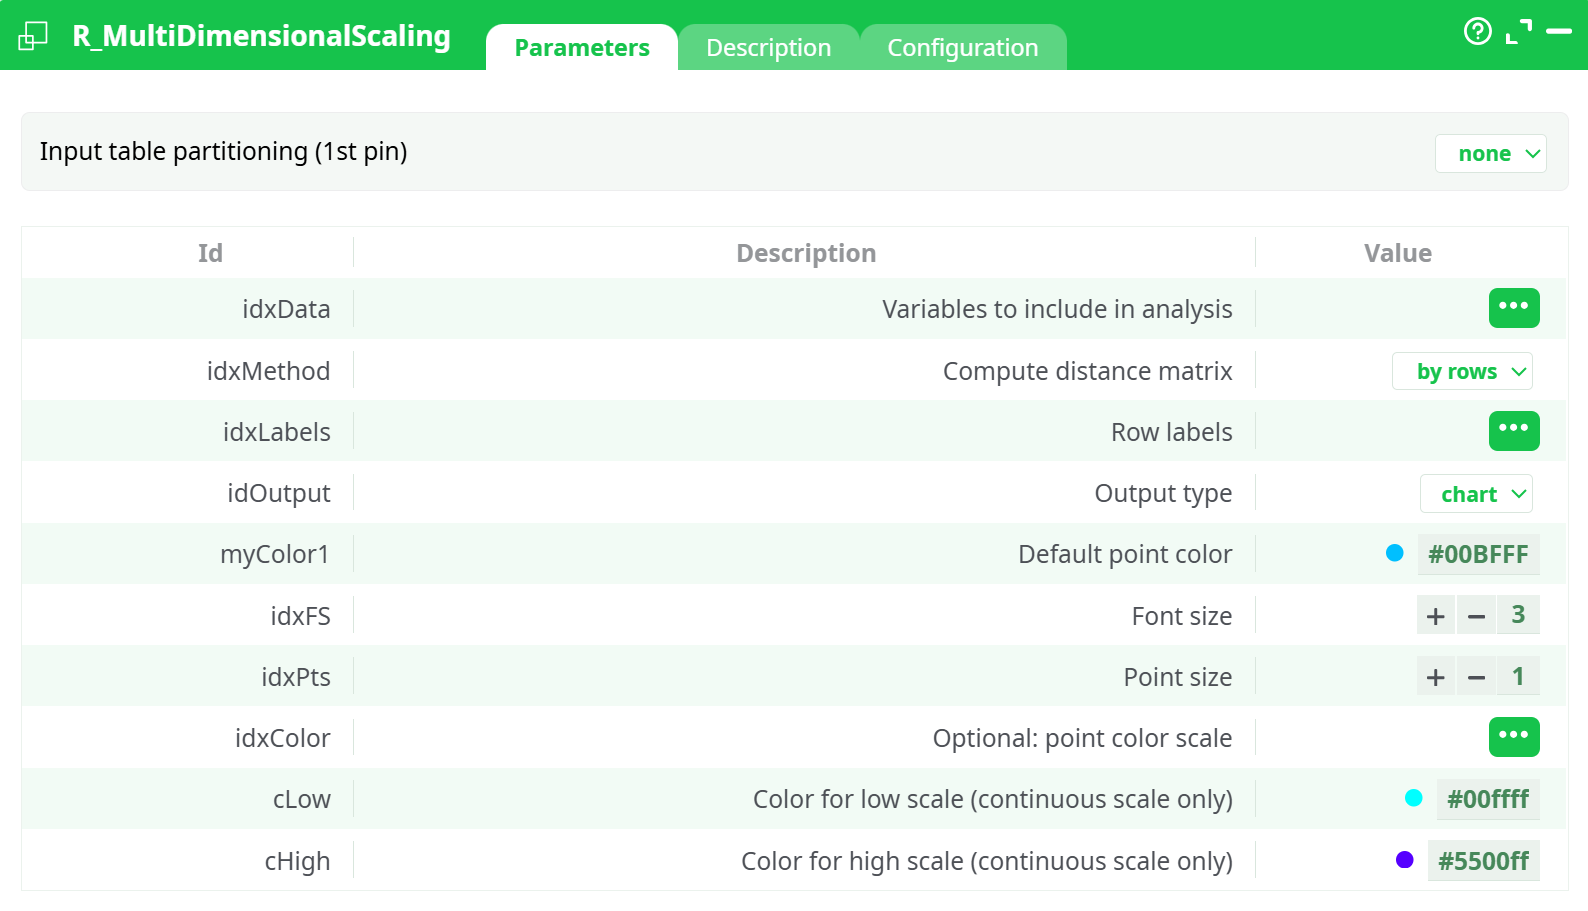
Parameters:
- Input table partitioning (1st pin)
- Variables to include in analysis
- Compute distance matrix
- Row labels
- Default point color
- Font size
- Point size
- Optional: point color scale
- Color for low scale (continuous scale only)
- Color for high scale (continuous scale only)
¶ Description tab
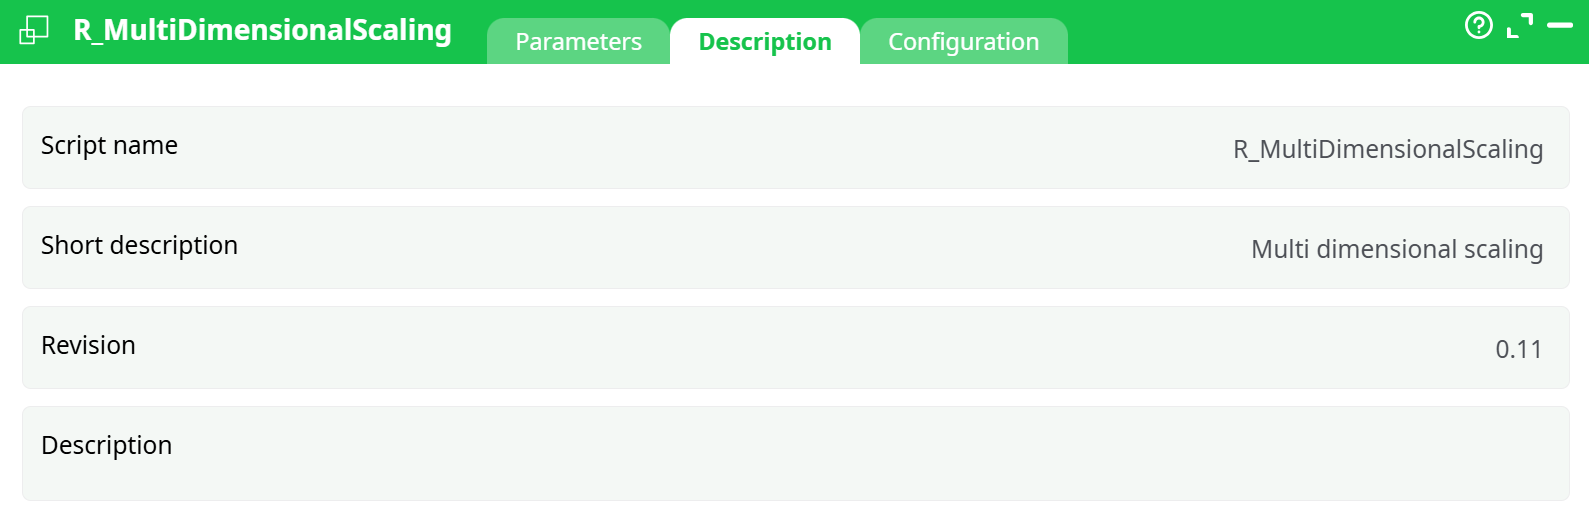
Parameters:
- Script name
- Short description
- Revision
- Description
¶ Configuration tab
See dedicated page for more information.
¶ About
R_MultiDimensionalScaling performs Multidimensional Scaling (MDS), a technique used to visualize similarities or dissimilarities in data. It is especially effective in reducing high-dimensional data to 2D or 3D for interpretation.
MDS transforms a distance matrix (calculated from the input features) into a geometric representation where similar observations appear closer together.
Use this action to gain visual insight into clustering, similarity patterns, or the structure of the data — especially when Principal Component Analysis (PCA) is not suitable or too linear.
Notes:
idxColor,idxFS, andidxPtsare optional but enhance visual clarity.- Output can be static images or interactive 3D HTML.
- For numeric scale, make sure the column type is float/key, not string.
¶ Input Table Example
File: R_MultiDimensionalScaling_Input.csv
| ID | X1 | X2 | X3 | Group |
|---|---|---|---|---|
| A | 2.5 | 3.6 | 1.2 | 1 |
| B | 2.8 | 3.3 | 1.0 | 2 |
| C | 3.1 | 2.9 | 1.1 | 3 |
X1, X2, X3are passed intoidxDataIDis used inidxLabelsGroup(optional) can be used foridxColor
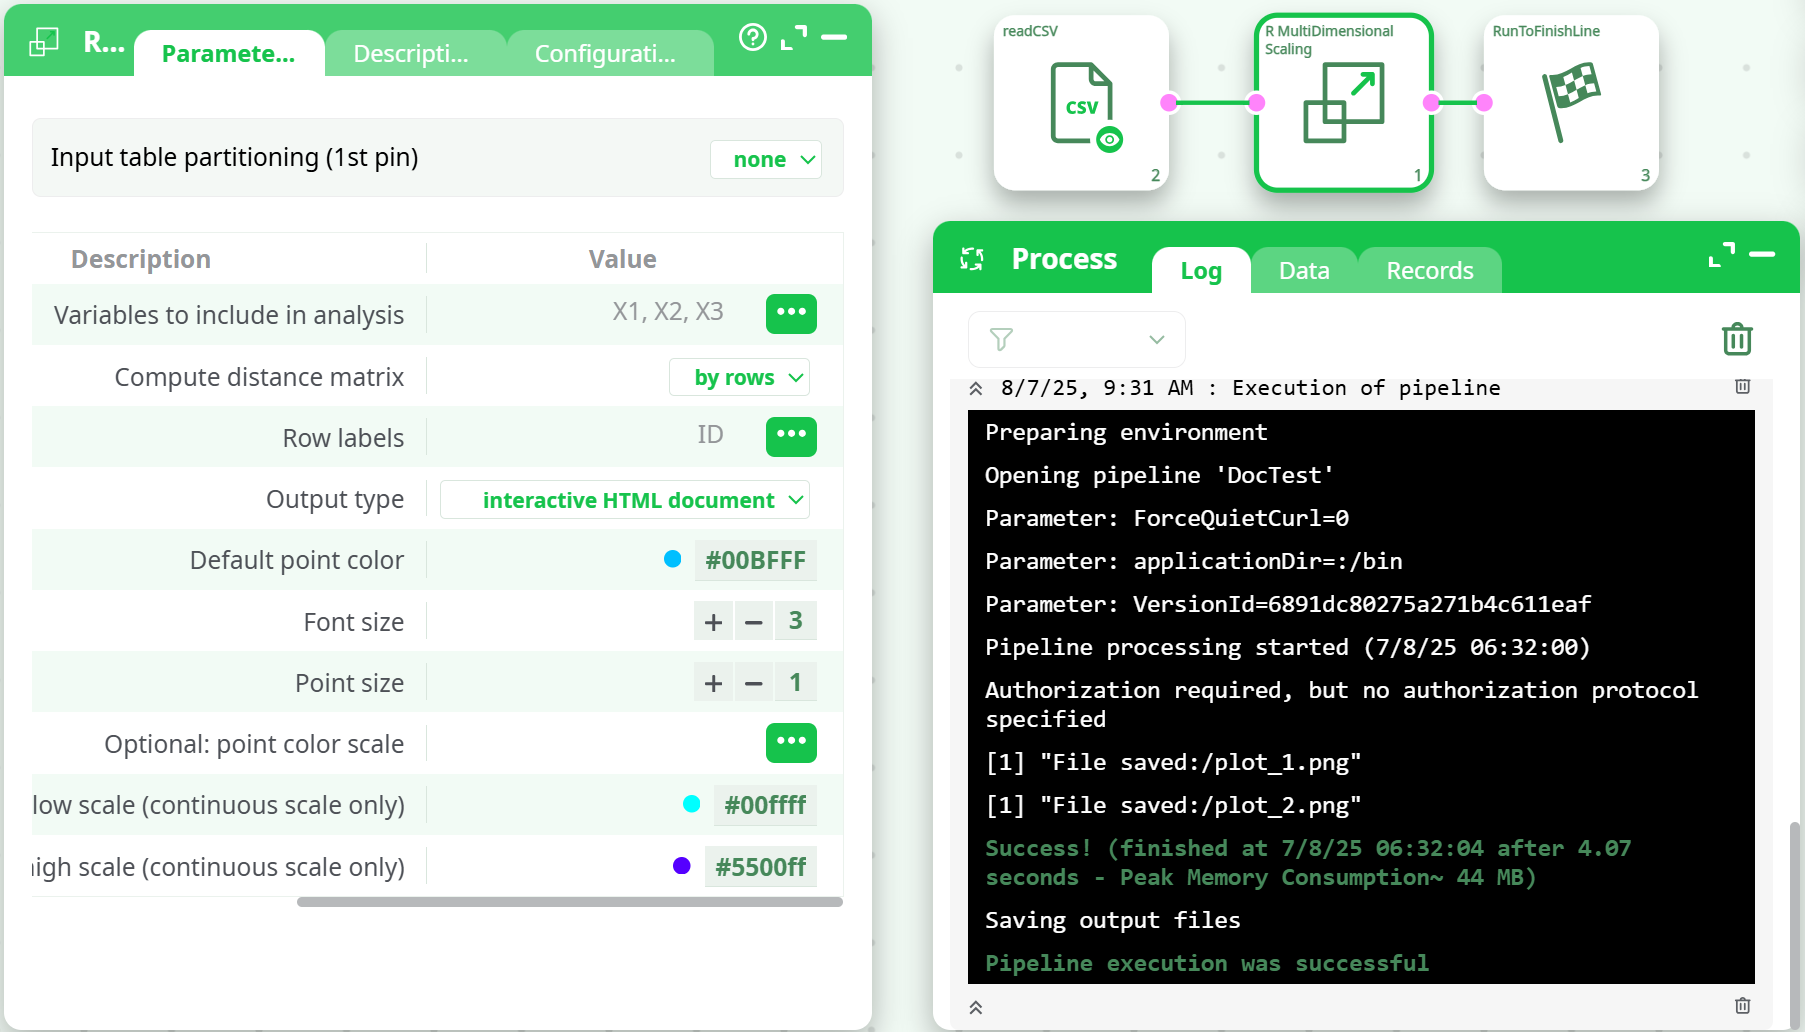
¶ Execution Workflow
-
Distance Matrix Calculation:
- Select
by rowsto compare observations (most common). - Or use
by columnsto explore variable similarity.
- Select
-
MDS Projection:
- Distance matrix is reduced to 2 or 3 dimensions.
- Coordinates are calculated for best approximation.
-
Output Generation:
- Choose
chart(static image) orinteractive HTML documentfor rotatable 3D charts. - Optional columns like
idxColorandidxPtsenhance clarity.
- Choose
¶ Output Files
plot_1.png: MDS projection (2D)plot_2.png: Optional second plot or color-scaled chartmds_interactive.html: Interactive 3D plot (if selected)
¶ Best Practices
- Combine with PCA for complementary insights.
- If dataset is large, monitor memory use — MDS computes full distance matrix.
- Use scaled features (X1, X2, X3) for best visual clustering.