¶ Description
Compute the PCA.
¶ Parameters
¶ Parameters tab
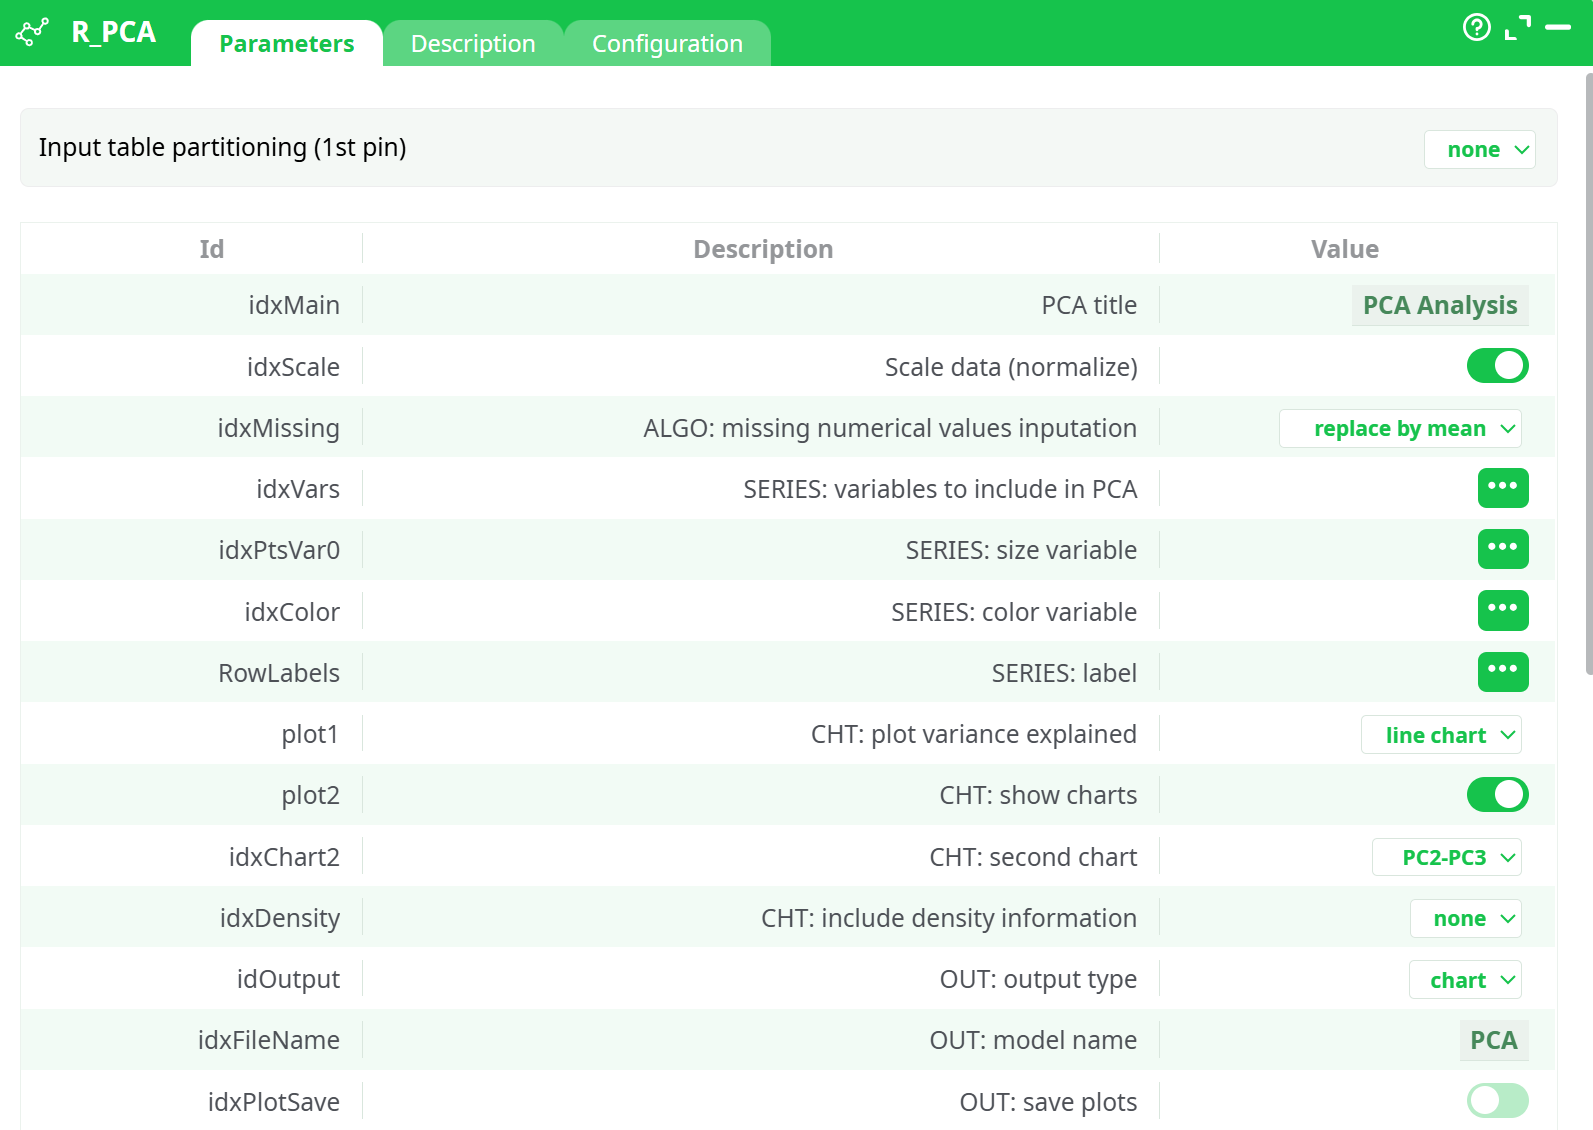
Parameters:
- Input table partitioning (1st pin)
- PCA title
- Scale data (normalize)
- SERIES: variables to include in PCA
- SERIES: size variable
- SERIES: color variable
- SERIES: label
- CHT: plot variance explained
- CHT: show charts
- CHT: second chart
- CHT: include density information
- OUT: Save PCA Model
- OUT: add time stamp
- OUT: include PC in output
- POINT: fixed color (if no color variable)
- POINT: low scale color
- POINT: high scale color
- POINT: transparency
- POINT: size
- ARROW: color
- ARROW: label color
- PIN2: preference color
- PIN2: preference type
- PIN2: transparency
- PIN1: variable names
- PIN2: individual preference data
¶ Description tab
Parameters:
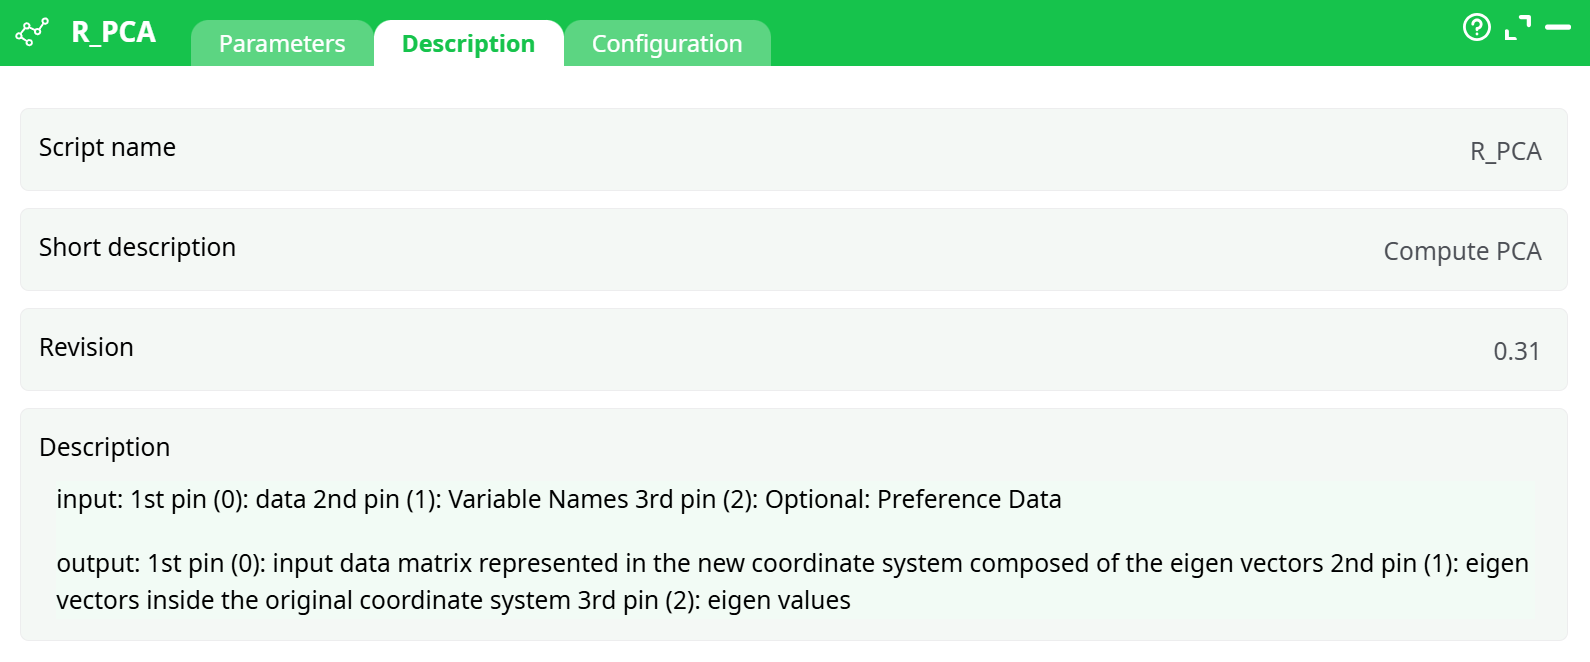
- Script name
- Short description
- Revision
- Description
¶ Configuration tab
See dedicated page for more information.
¶ About
The R_PCA action button performs Principal Component Analysis (PCA), a powerful technique for dimensionality reduction and exploratory data analysis. PCA transforms a high-dimensional dataset into a set of linearly uncorrelated components, called principal components, ordered by their ability to explain variance in the data.
This action is especially useful when working with datasets containing many numeric features. By projecting data onto the principal components, users can identify underlying patterns, groupings, and relationships between observations and variables. The transformation is visualized through interactive 2D or 3D biplots and variance plots generated in HTML format.
¶ Input
This action accepts up to three input tables:
- Pin 0 (Required) – Main input data table (numerical variables only)
- Pin 1 (Optional) – Variable names to include in PCA
- Pin 2 (Optional) – Preference dataset to project onto the PCA space
The main data (Pin 0) should contain rows as observations and columns as features. Categorical variables should be excluded or preprocessed. Missing values can be automatically handled.
¶ Output
Upon successful execution, the action generates:
- Transformed data table with principal components (Pin 0)
- Eigenvectors (Pin 1) — original variable loadings in PC space
- Eigenvalues (Pin 2) — variance explained by each component
- PCA_PCA.HTML – An interactive variance and 2D/3D component plot
- PCA_PCAPlot.HTML – Interactive 3D biplot with arrows and clusters
These outputs are accessible in the Records tab or via downstream components.
¶ How to Run
-
Prepare Input Data
Upload a clean numeric dataset to be analyzed. Ensure no categorical variables are included inidxVars. -
Configure Parameters
- Name the analysis using
idxMain - Select the relevant variables in
idxVars - Enable
idxScalefor standardization - Set
plot1toline chartorbar chartfor variance visualization - Set
plot2to true to enable the component scatter/biplot
- Name the analysis using
-
Enable Outputs
- Toggle
idxPlotSaveto save chart HTML files - Toggle
idxPredictto write PCs into the output table - Optionally enable
idxSaveModelto save the trained PCA model
- Toggle
-
Run the Pipeline
Execute the workflow and wait for completion. Once done, the interactive HTML outputs can be viewed from the Records tab.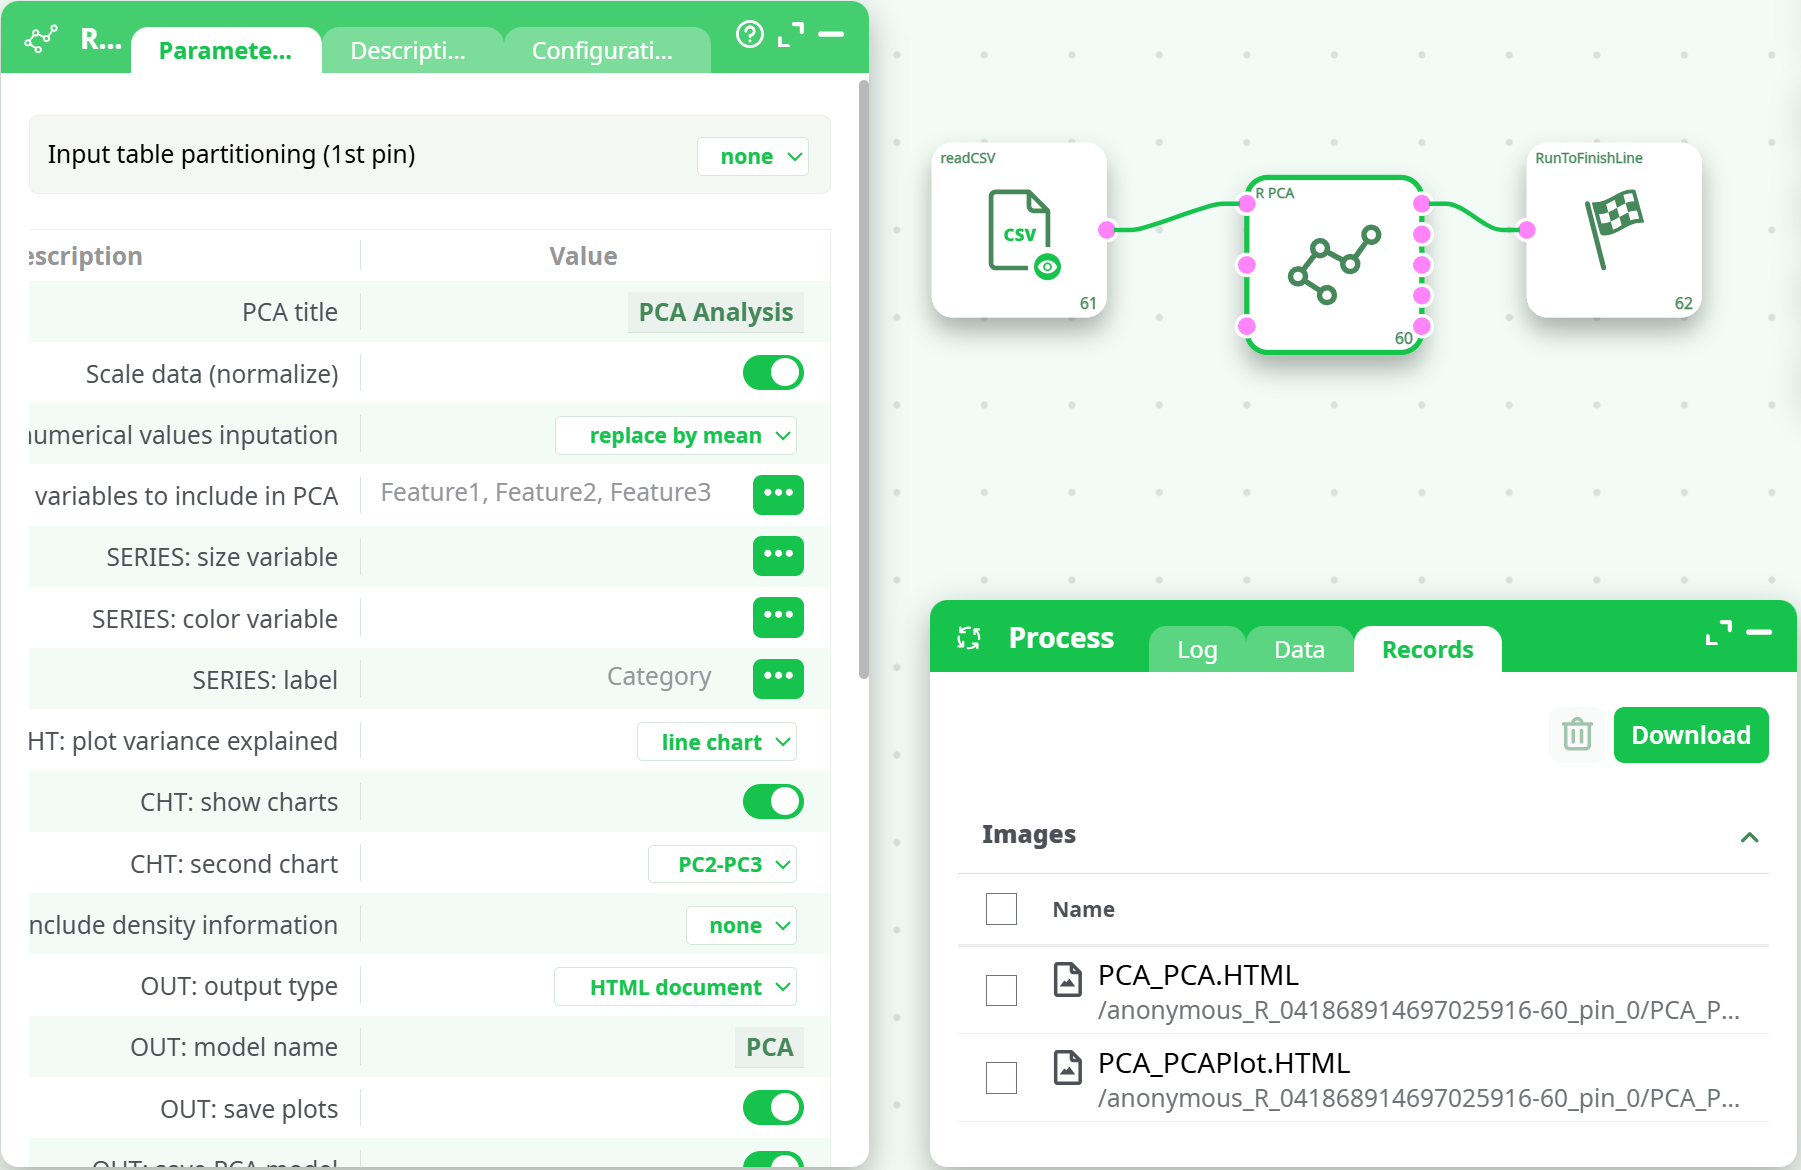
¶ Example
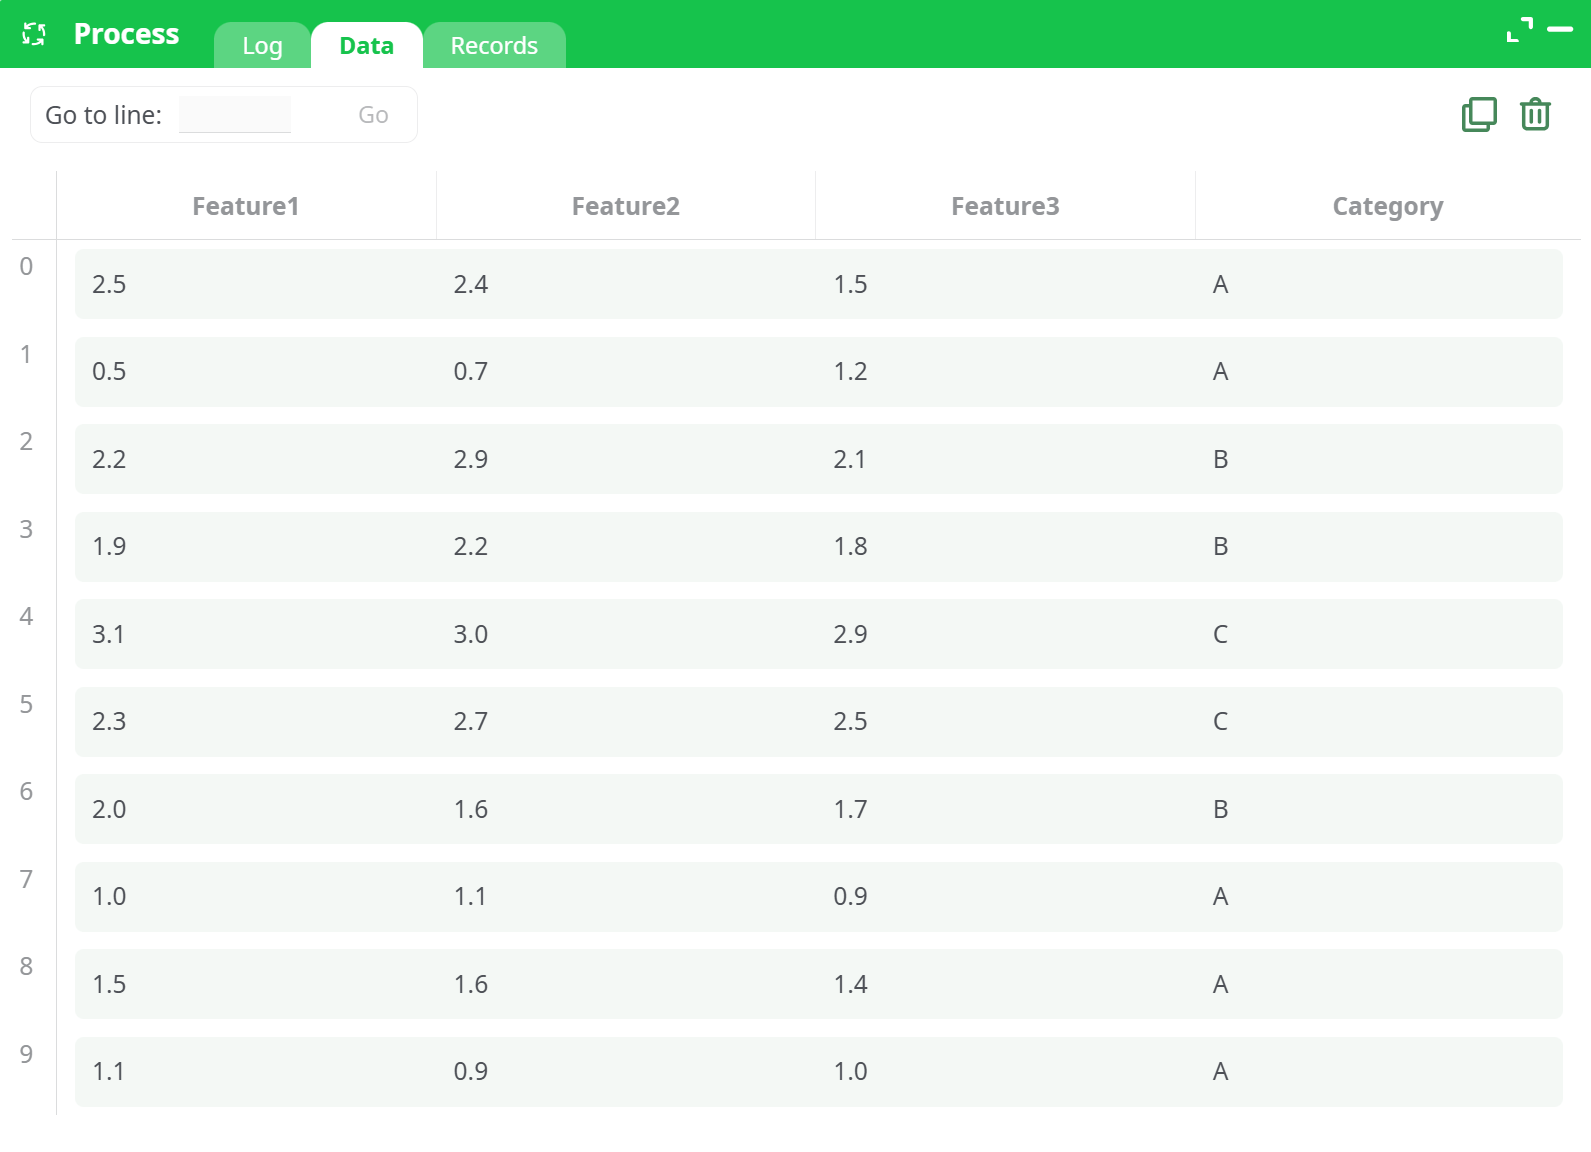
Sample Input Table
| Feature1 | Feature2 | Feature3 | Category |
|---|---|---|---|
| 2.1 | 3.4 | 1.2 | A |
| 1.9 | 3.1 | 0.8 | A |
| 3.2 | 4.1 | 2.3 | B |
| 3.0 | 4.0 | 2.1 | B |
| 4.5 | 5.3 | 3.9 | C |
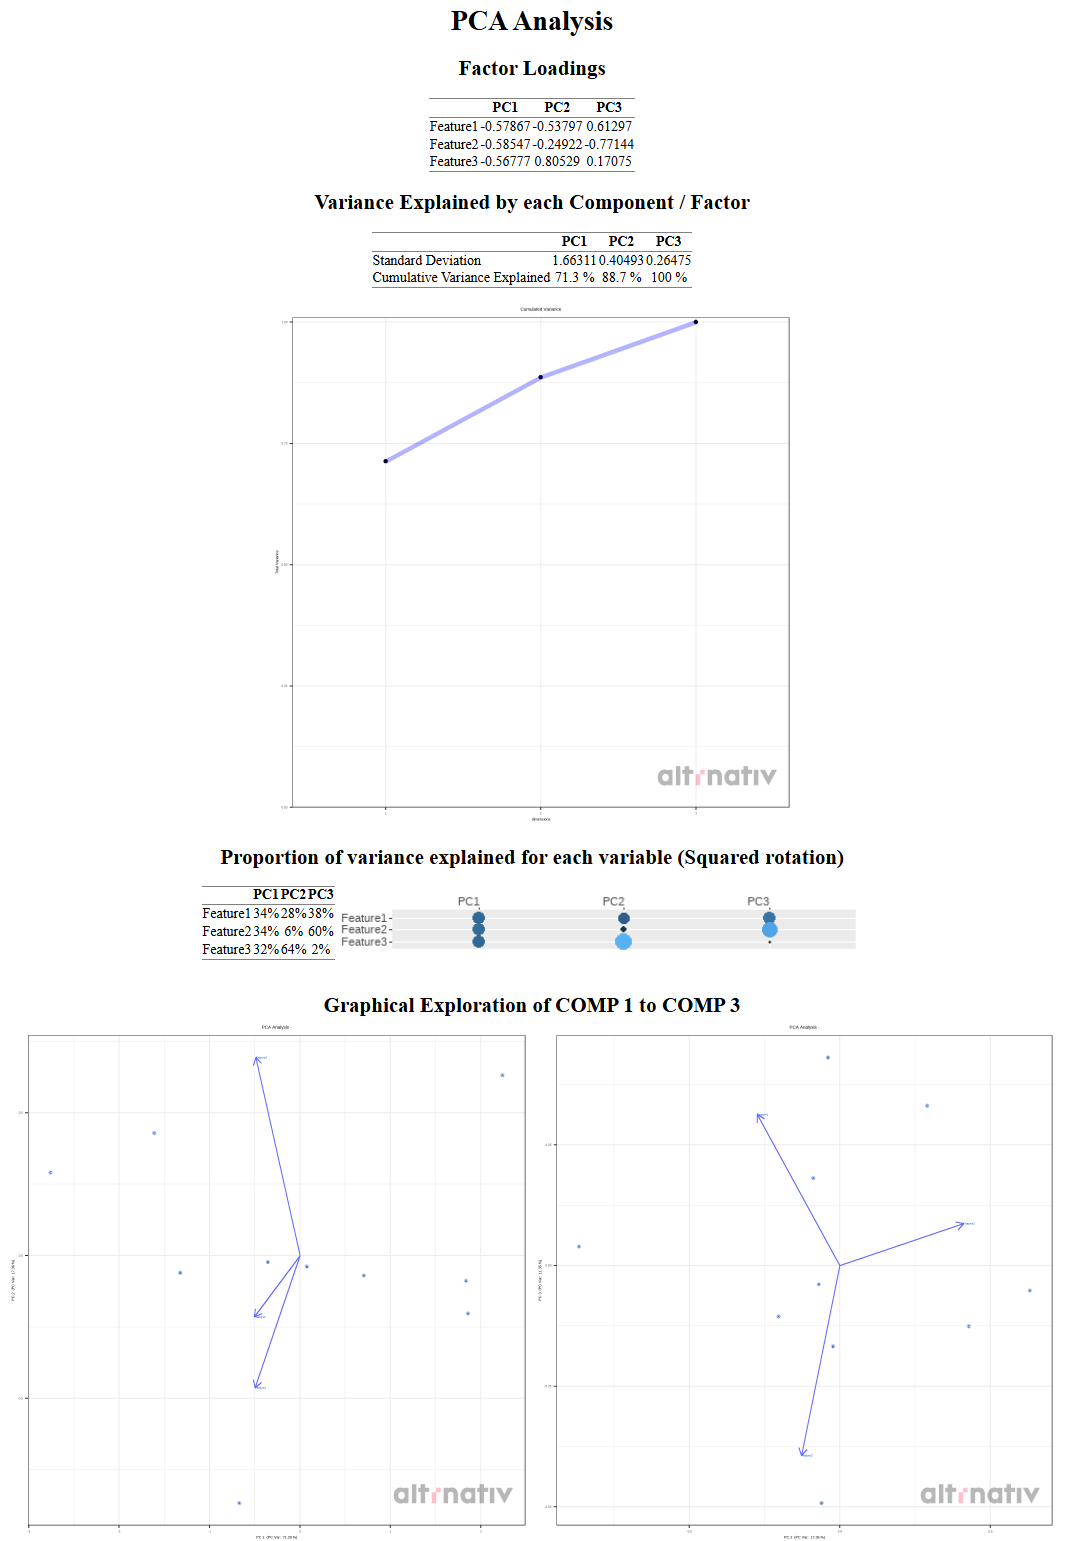
Output Charts:
PCA_PCA.HTML: Explained variance across components
PCA_PCAPlot.HTML: 3D biplot with labeled points and variable vectors
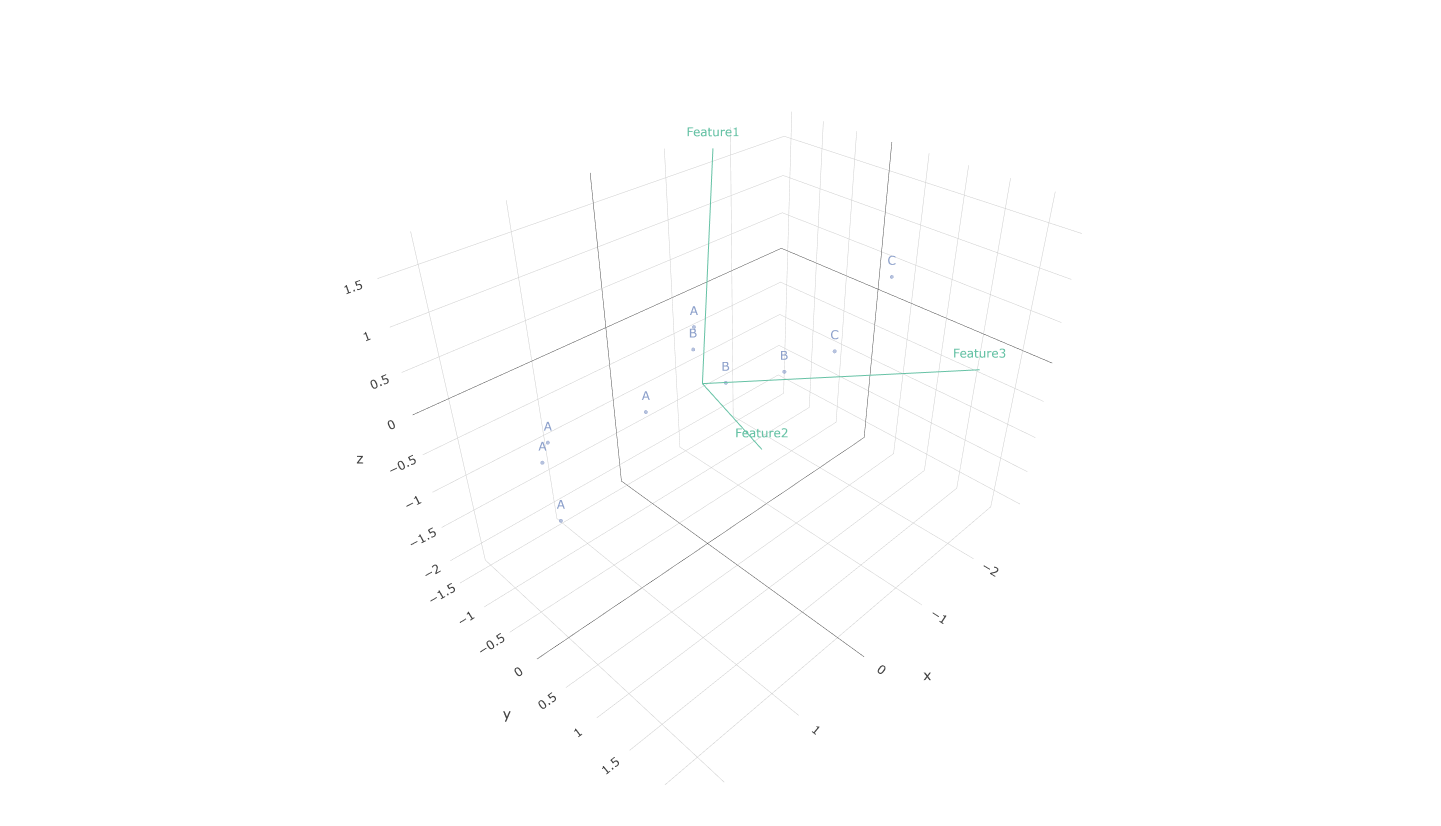
This interactive plot can be rotated and zoomed.
¶ Use Cases
- Feature Reduction – Reduce dimensionality before feeding data into machine learning models.
- Pattern Recognition – Explore underlying clusters or trends in multi-dimensional data.
- Projection of Preference Data – Compare new or external data using the same PCA space.
¶ Interpretation Tips
- Explained Variance: The first components usually capture the most structure. Use the variance plot to decide how many PCs to retain.
- Biplot Arrows: Long arrows indicate strong influence; direction reveals correlation.
- Clusters: Groups in the plot suggest similar observations — ideal for segmentation or classification.
¶ Advanced Options
- Preference Data (Pin 2): Use this when comparing two datasets in the same PCA space (e.g., training vs. new samples).
- Model Saving: Saved PCA models can be reused across workflows for consistency in projections.
¶ Summary
The R_PCA action is a flexible and powerful PCA implementation built on R. With support for interactive plots, preference data, output saving, and rich customization, it enables deep insight into data structure and variance.
Notes
- Always scale data for PCA to prevent bias due to variable magnitude.
- Consider excluding variables with low variance or many missing values.
- PCA assumes linearity — nonlinear structures may not be well represented.