¶ Description
Create a Pie Chart.
¶ Parameters
¶ Parameters tab
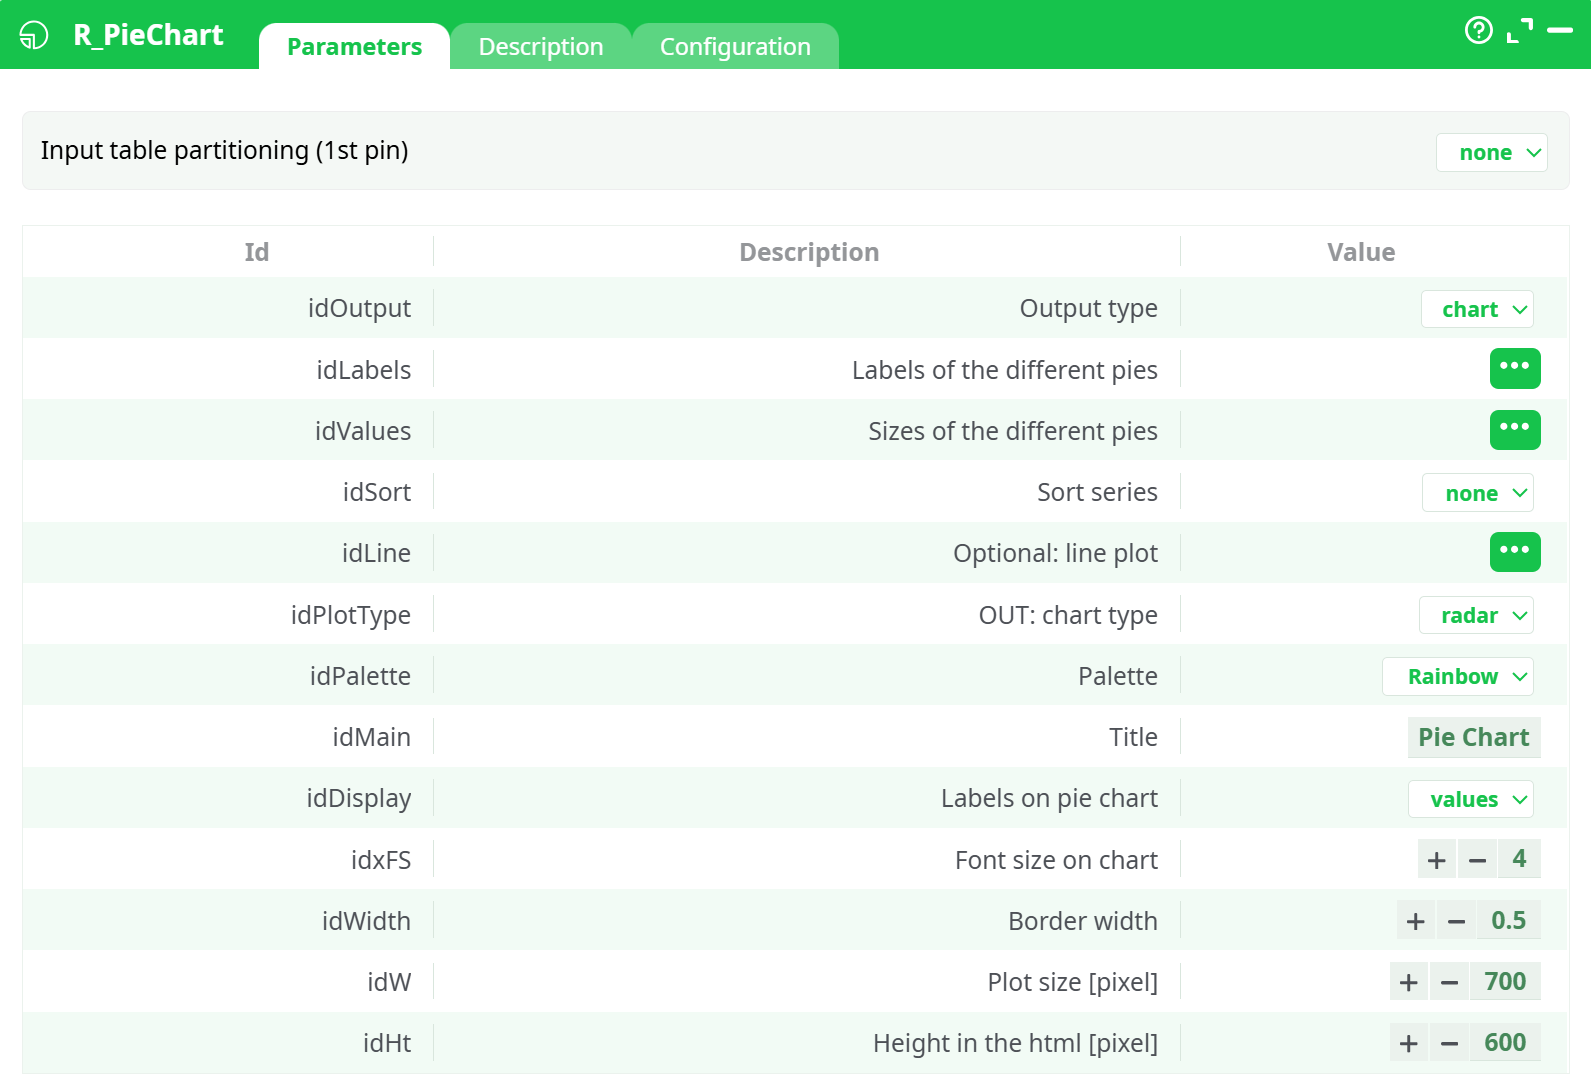
Parameters:
- All Data
- Labels of the different pies
- Sizes of the different pies
- Palette
- Title
- Labels on pie chart
- Font size on chart
- Border width
- PNG Plot size (pixels)
¶ Description tab
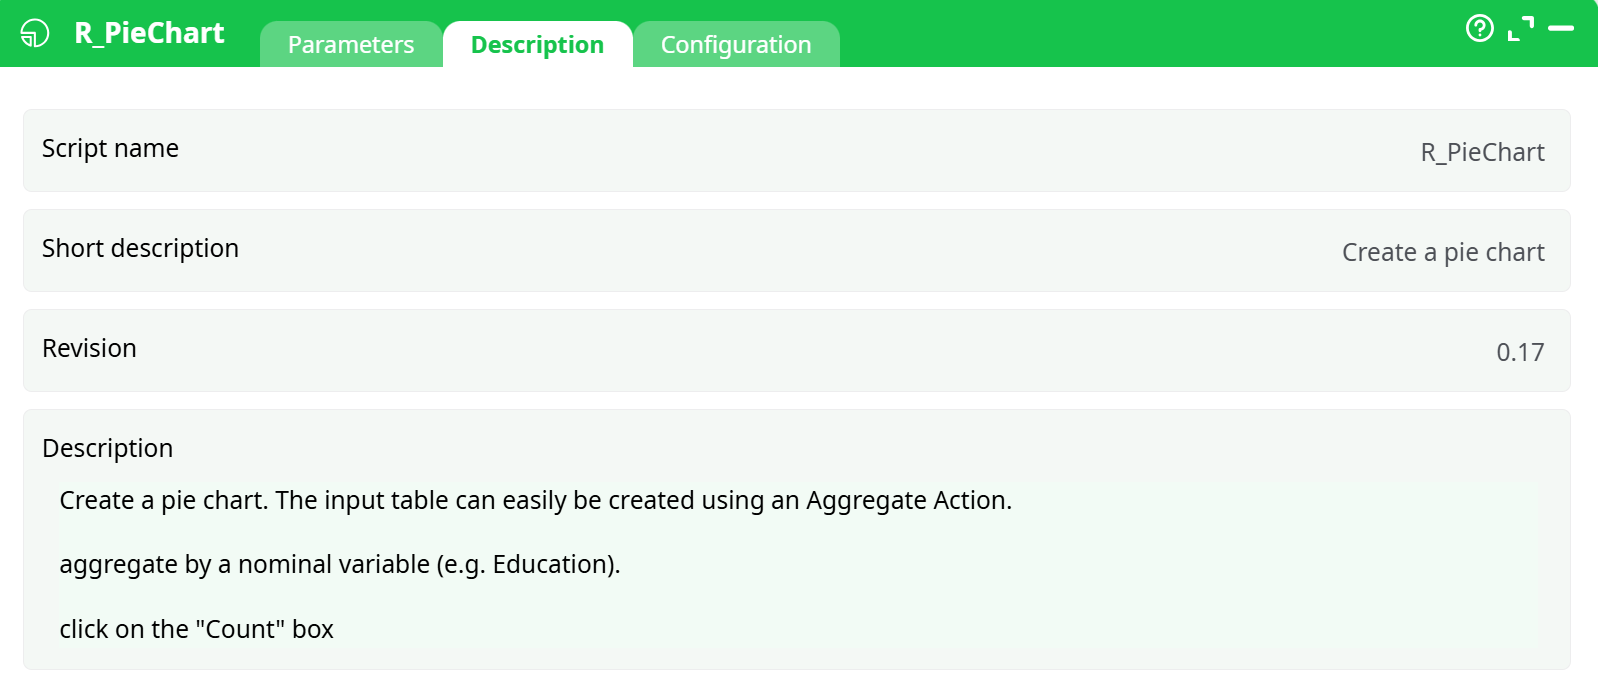
Parameters:
- Script name
- Short description
- Revision
- Description
¶ About
This plot is a popular visualization, although it should not be used in most cases as a histogram typically gives a better visualization.
The input table is:
- first column: the different labels of the different pies.
- second column: the sizes of the different pies.
The input table can easily be created using an Aggregate Action.
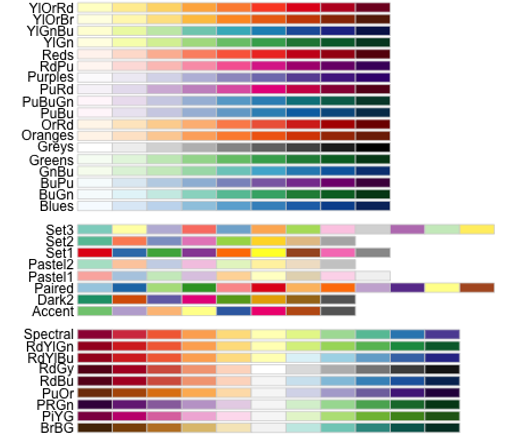
The different available palettes are:
The R PieChart action button is used to create pie charts from tabular data using R-based rendering. It takes label-value pairs from an input table and produces a high-quality pie chart image for visualization and reporting purposes.
This action button leverages the R language to render pie charts from data contained in two columns:
- One for labels (categories or groups)
- One for values (frequencies or weights)
The resulting chart is saved as a .png image file and can be viewed in the Records tab after execution.
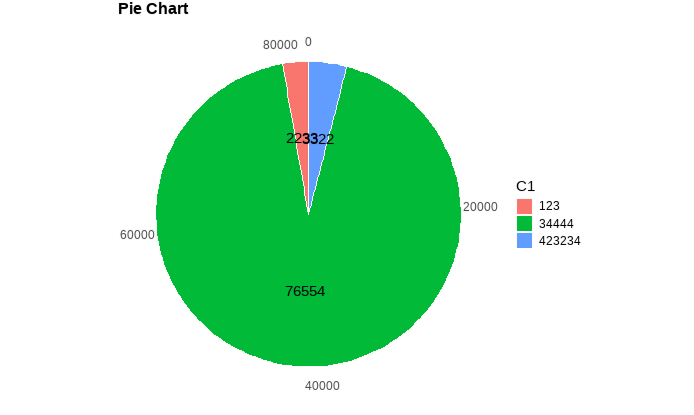
¶ Input Example
Use an InlineTable or similar component to feed the following data into the R PieChart:
| C1 | C2 |
|---|---|
| 123 | 2233 |
| 423234 | 3322 |
| 34444 | 76554 |
Configure the columns list:
idLabels: C1idValues: C2
¶ ▶️ Execution Steps
- Drag the
R PieChartaction button onto your pipeline. - Connect it to a data source (e.g., InlineTable).
- Configure the required parameters:
- Set
idLabelsto the column containing the labels (e.g.,C1) - Set
idValuesto the column containing the values (e.g.,C2) - Customize visual settings (palette, font size, title, etc.)
- Set
- Set output chart dimensions and appearance.
- Run the pipeline.
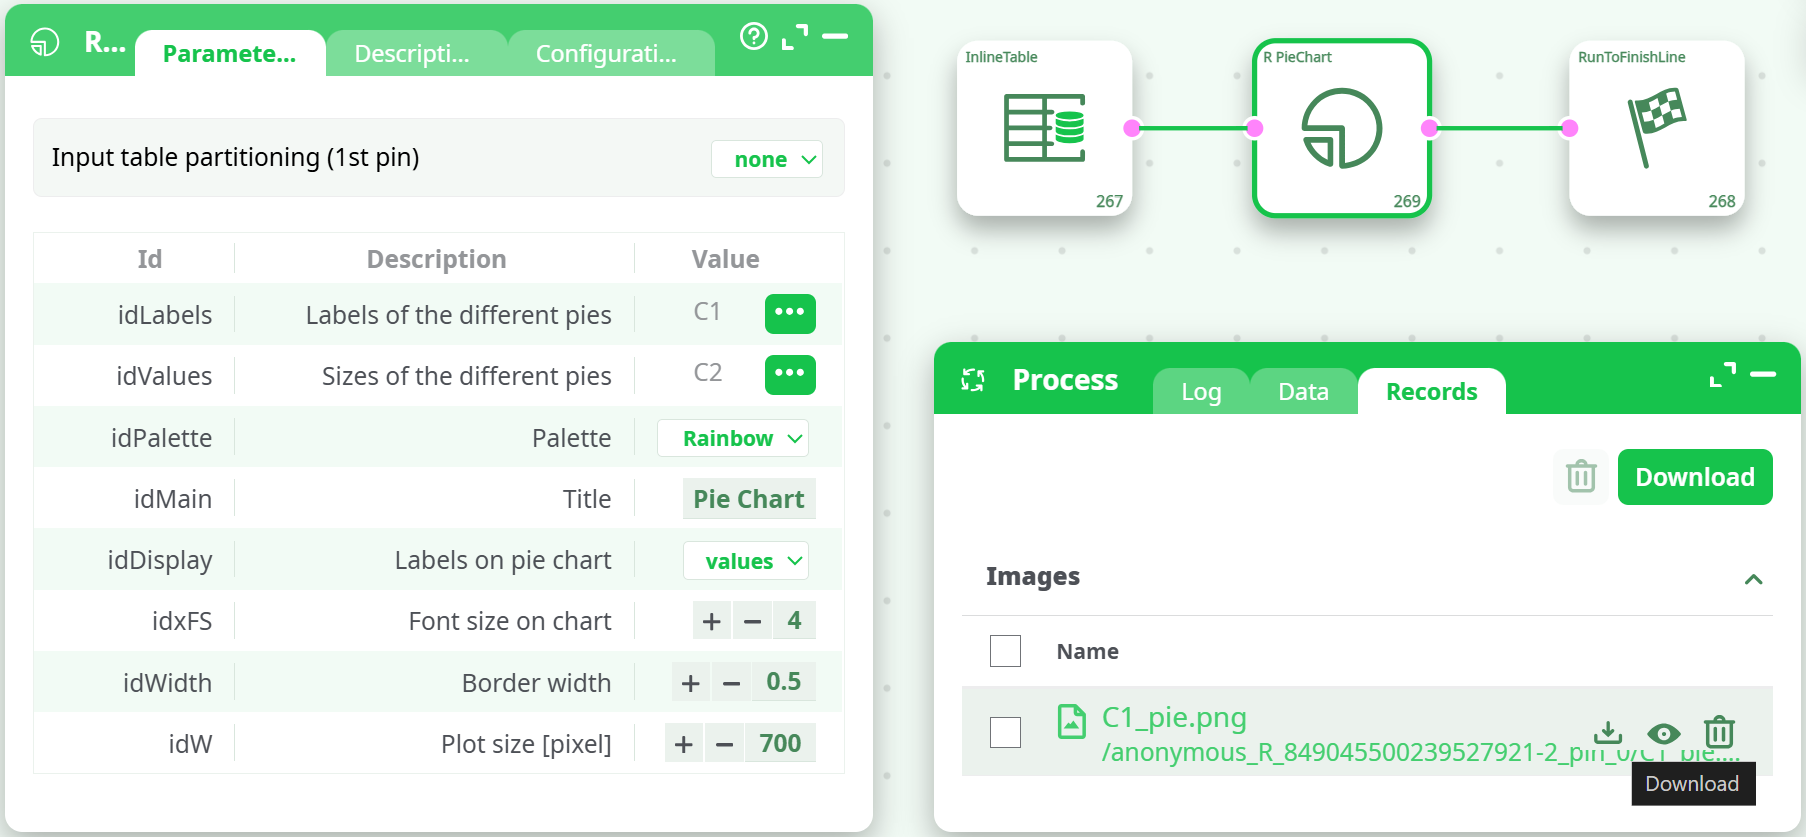
¶ Output
- A
.pngfile will be generated in the Records tab. - It contains the rendered pie chart with slices sized and labeled according to your input.
- You can download or preview it directly from the UI.
¶ Notes
- Ensure the
idValuescolumn contains numeric values. - Use meaningful
idLabelsto improve interpretability. - The pie chart does not support negative or missing values.
- For dynamic pie generation per group, enable Input table partitioning.
¶ Example Use Cases
- Visualizing categorical data distribution.
- Generating KPI dashboards with visual summaries.
- Creating graphical representations of market share or product distribution.