¶ Description
Plot a time series.
¶ Parameters
¶ Parameters tab
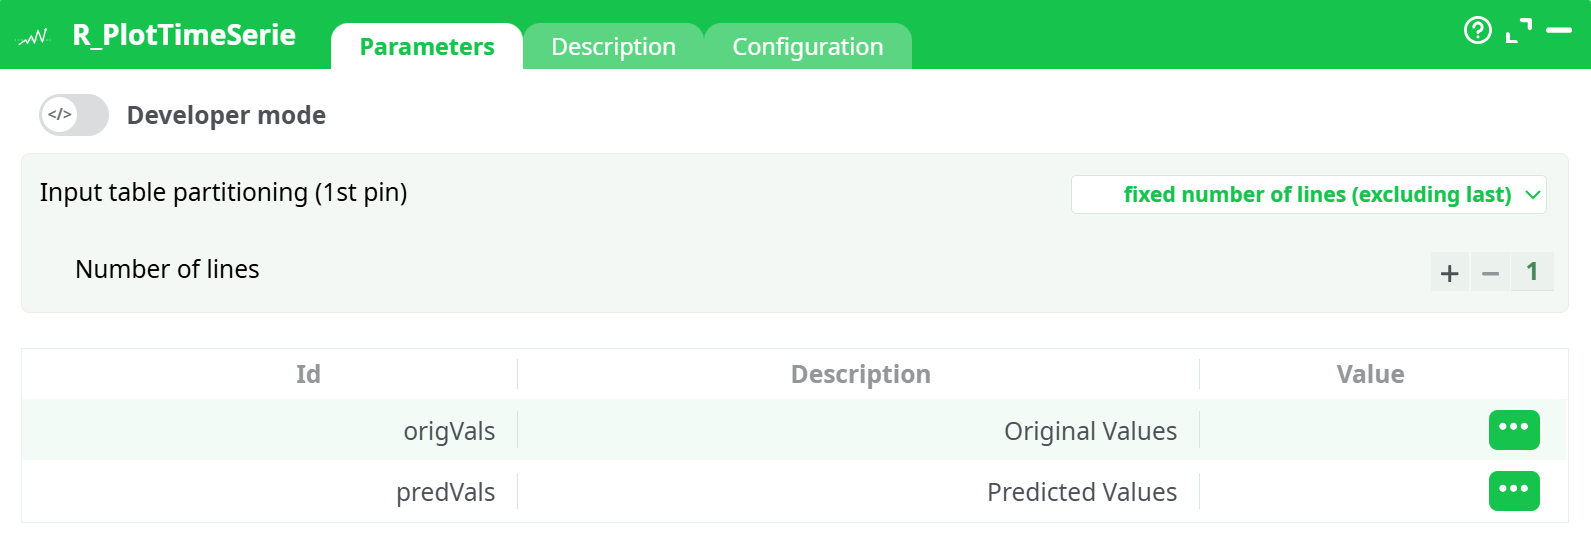
Parameters:
- Input table partitioning (1st pin)
- Number of lines
- Original Values
- Predicted Values
¶ Description tab
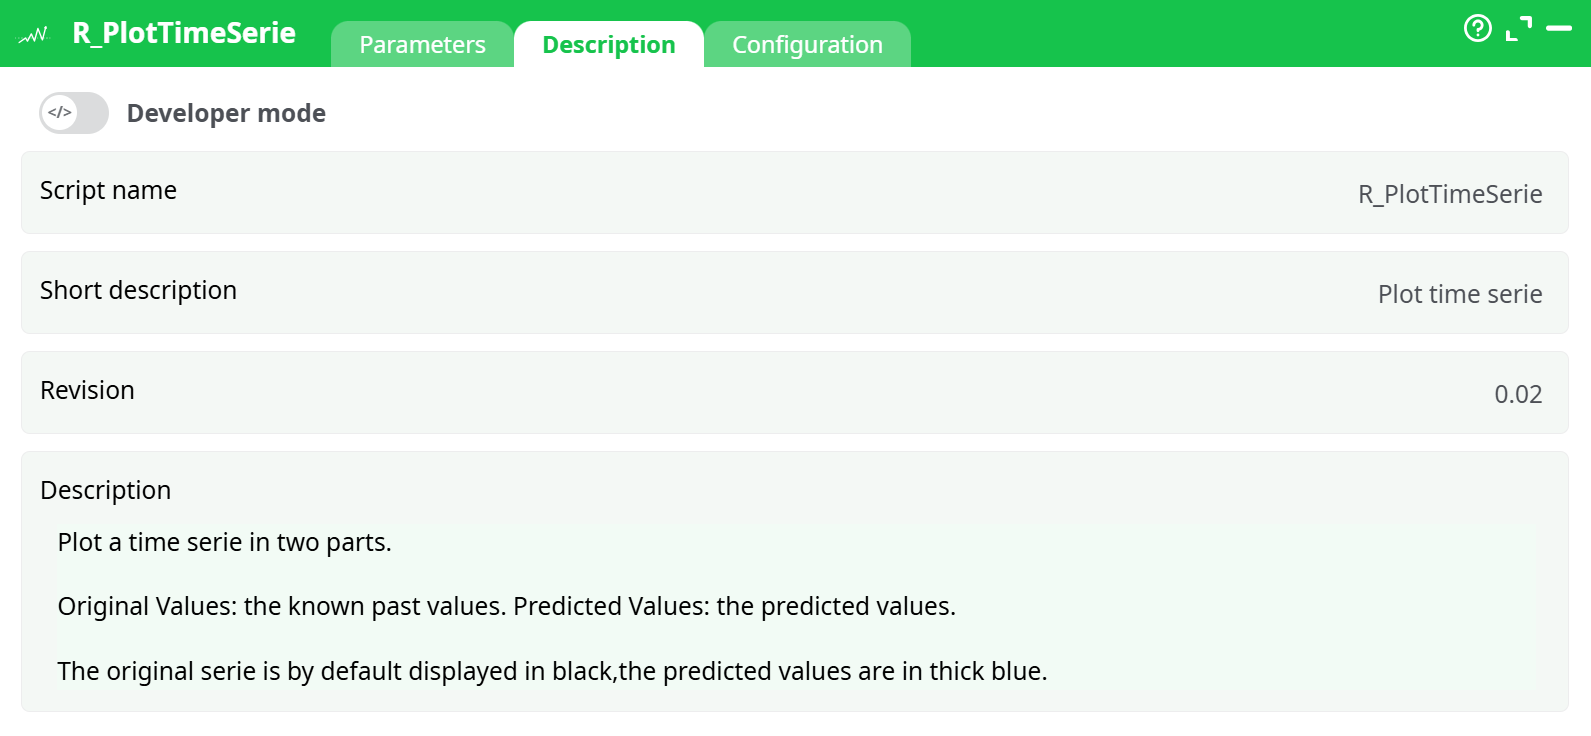
Parameters:
- Script name
- Short description
- Revision
- Description
¶ About
The R_PlotTimeSerie action generates a two-part time series plot comparing original values and predicted values over time.
- Original Values are shown in black.
- Predicted Values are shown in thick blue.
This action is particularly useful for visualizing forecasting models and comparing expected vs. actual performance.
¶ Input Table
The input table must contain two numeric columns:
origVals: actual/historical time series values.predVals: forecasted values.
¶ Example Input
| origVals | predVals |
|---|---|
| 120 | 120 |
| 125 | 122 |
| 130 | 126 |
| 128 | 132 |
| 129 | 134 |
| 132 | 138 |
| 137 | 140 |
File: r_plot_time_serie_input.xlsx
¶ Output Example
The resulting chart displays the time series:
- Black line: Original values
- Thick blue line: Predicted values