¶ Description
Compare if two means are equal.
¶ Parameters
¶ Parameters tab
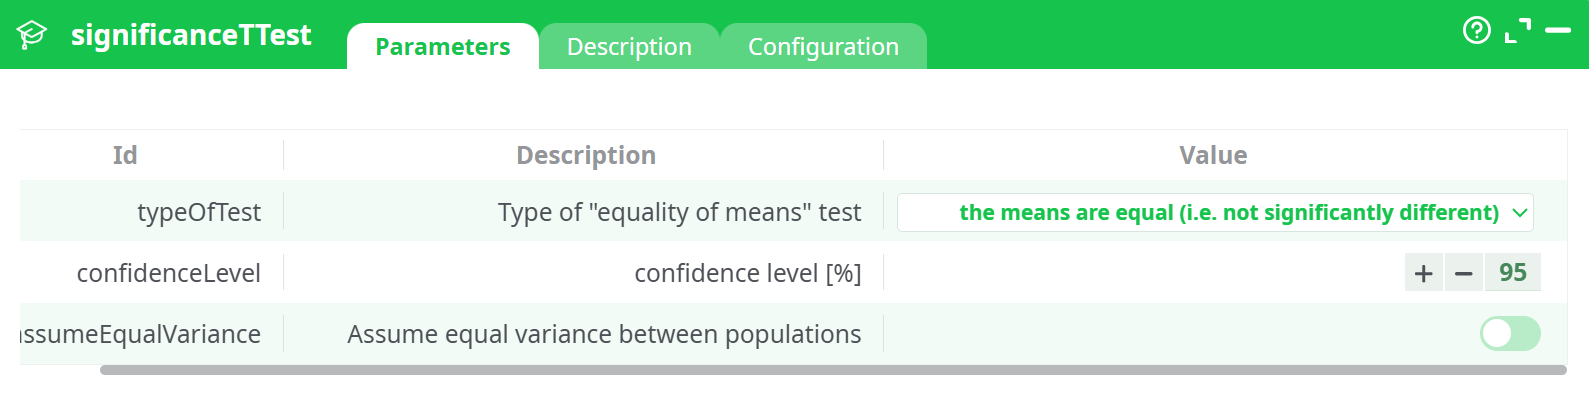
Parameters:
- Type of "equality of means" test
- Confidence level (%)
- Assume equal variance between the populations
¶ Description tab
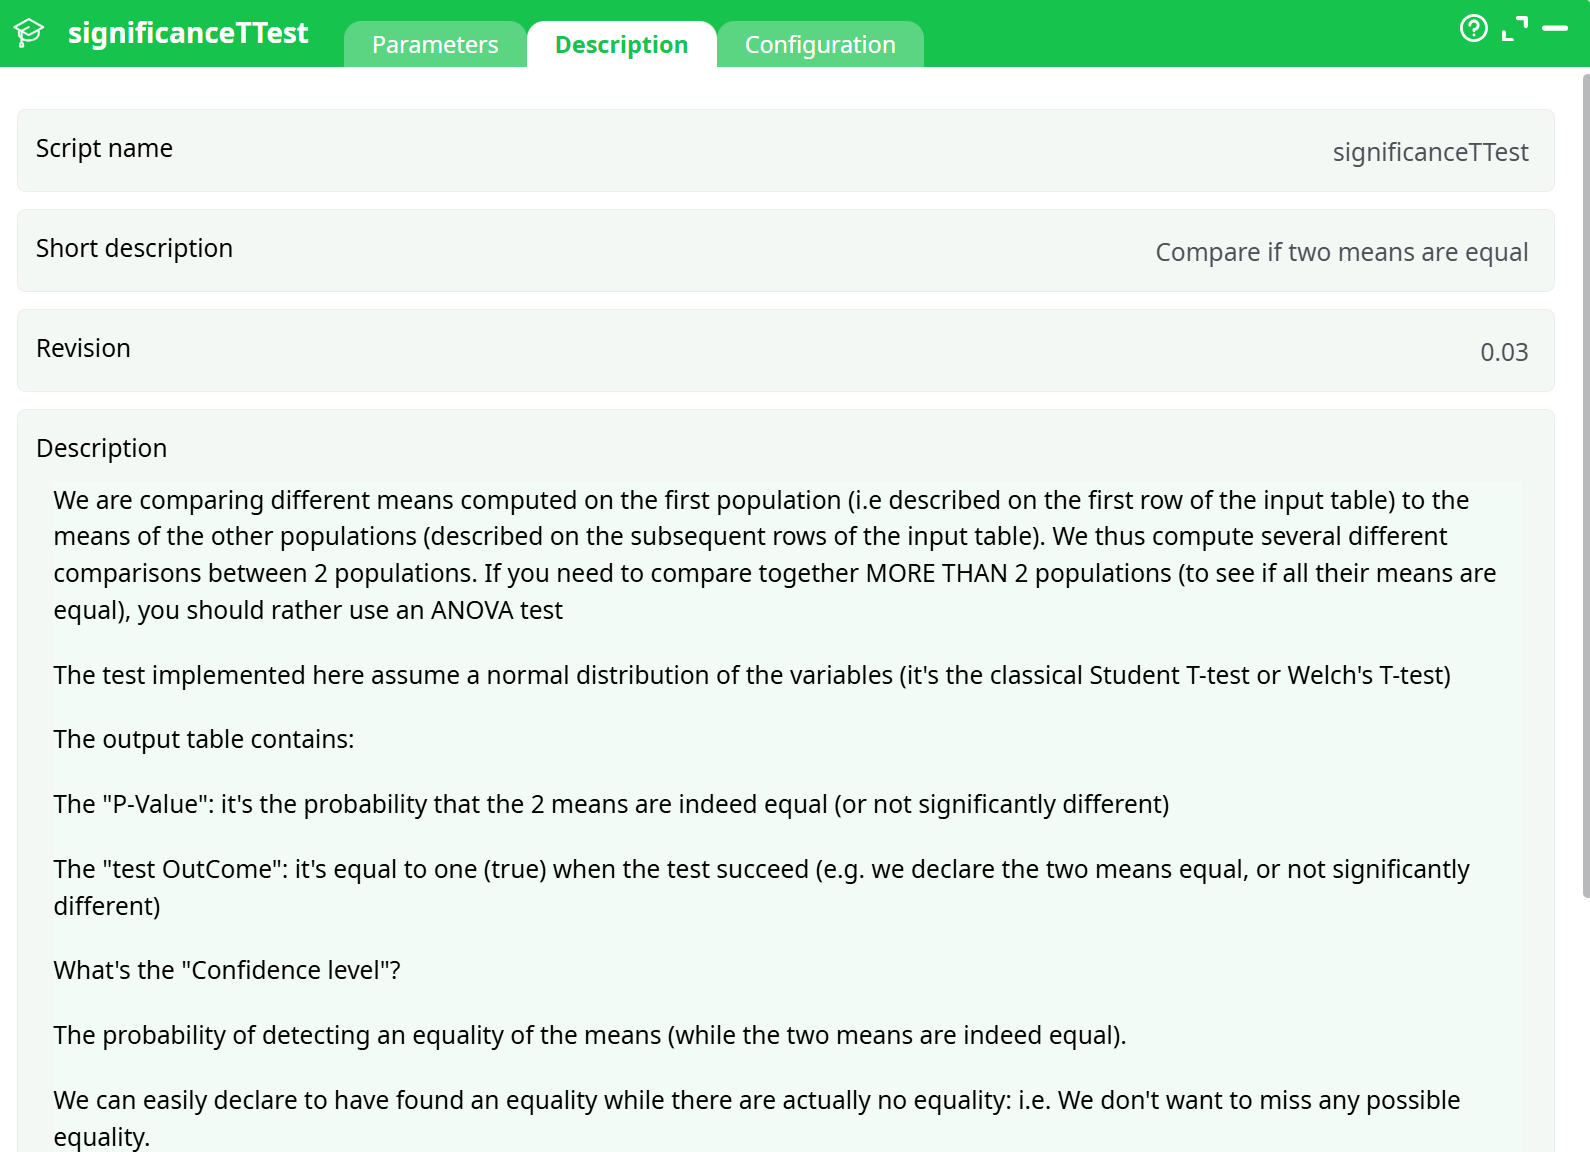
Parameters:
- Script name
- Short description
- Revision
- Description
¶ About
Performs a pairwise t-test to assess the statistical significance of the difference in means between a baseline population and multiple other populations.
This action compares the first row (baseline population) in the input table with each subsequent row using Student’s t-test or Welch’s t-test, depending on the assumption of equal variance. The output includes p-values and test outcomes indicating whether population means are statistically equal.
If you want to compare more than two populations simultaneously, consider using an ANOVA test instead.
¶ Input Example
📷 Input Table Screenshot

Self-explanatory. Each row represents a population, each column represents one observation per group.
The first row is treated as the baseline. Each subsequent row is compared to it.
Assumes normally distributed variables.
¶ Output
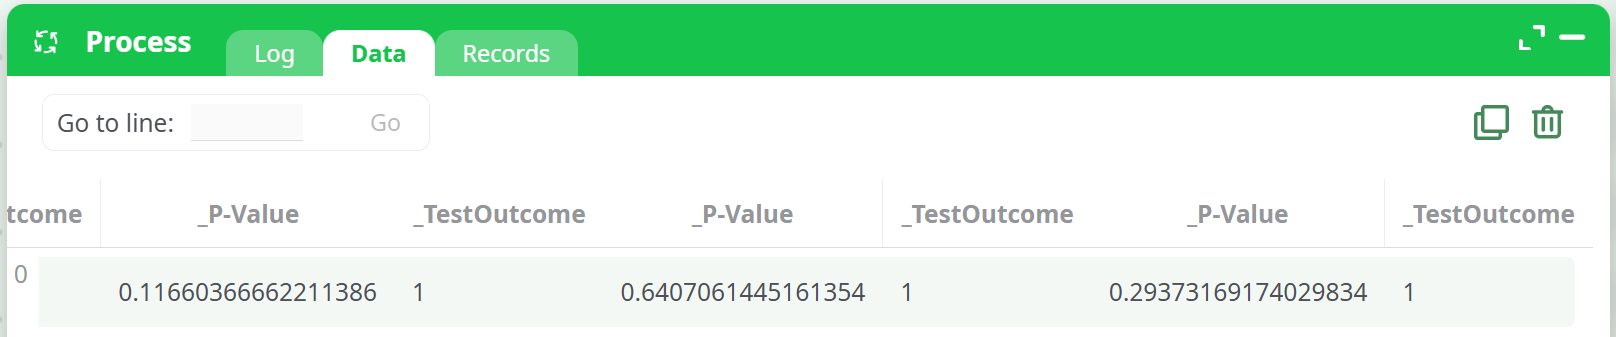
The output table includes the following columns:
| Column | Description |
|---|---|
Compared Populations |
Shows the baseline and the target population being compared (e.g. "104.96" vs "97.77") |
_P-Value |
Probability that the two population means are equal |
_TestOutcome |
1 if means are considered equal (null hypothesis accepted), 0 otherwise |
📷 Output Table Screenshot
¶ Interpretation
- P-Value: A high value (e.g. > 0.05) suggests no significant difference.
- TestOutcome = 1: The means are statistically equal (null hypothesis accepted).
- TestOutcome = 0: The means are statistically different (null hypothesis rejected).
¶ Confidence Level Explanation:
- A 95% confidence level means there's a 5% risk of incorrectly declaring that two means differ.
- Confidence Level = 100% − Significance Level
¶ Example Use Case
You're comparing the results of a treatment across multiple test groups. The first row contains results from the control group. You want to know whether the treated groups (rows 2–n) are significantly different from the control.
¶ Notes
- This action assumes normal distribution of values.
- If variance equality is not assumed, Welch’s test will be used.
- For comparing more than two groups simultaneously, use ANOVA.
See dedicated page for more information.