¶ Description
Execute an “unflatten” operation where each “set” is composed of one column.
¶ Parameters
¶ Parameters tab
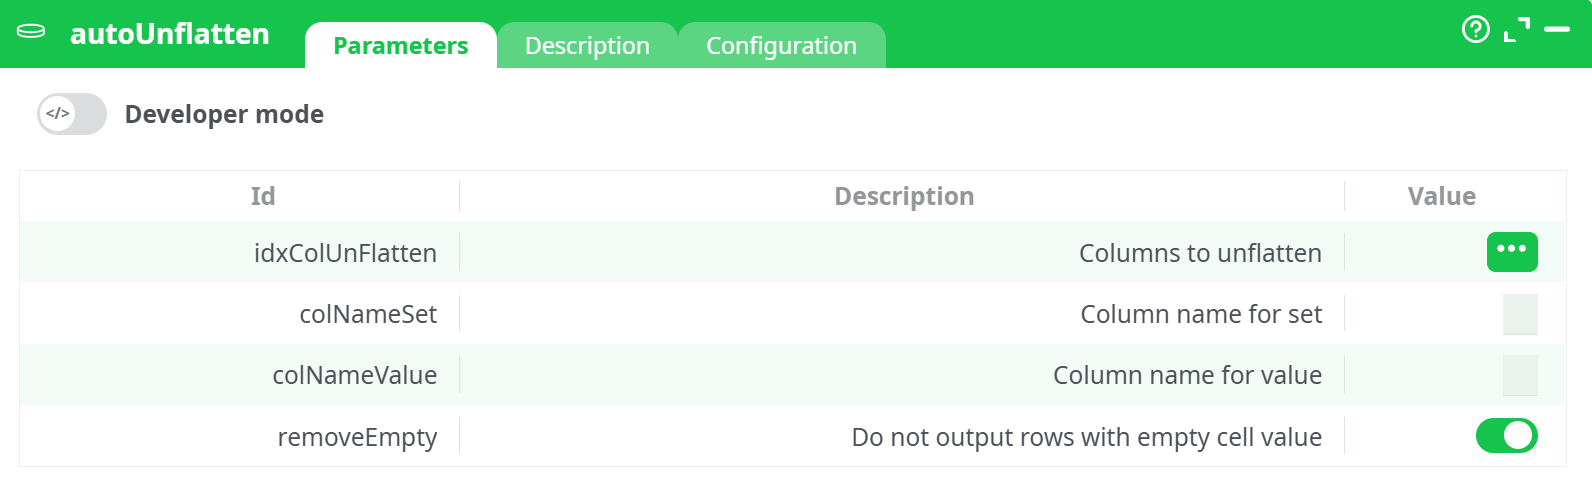
Parameters:
- Columns to unflatten
- Column name for set
- Column name for value
- Do not output rows with empty cell value
¶ Description tab
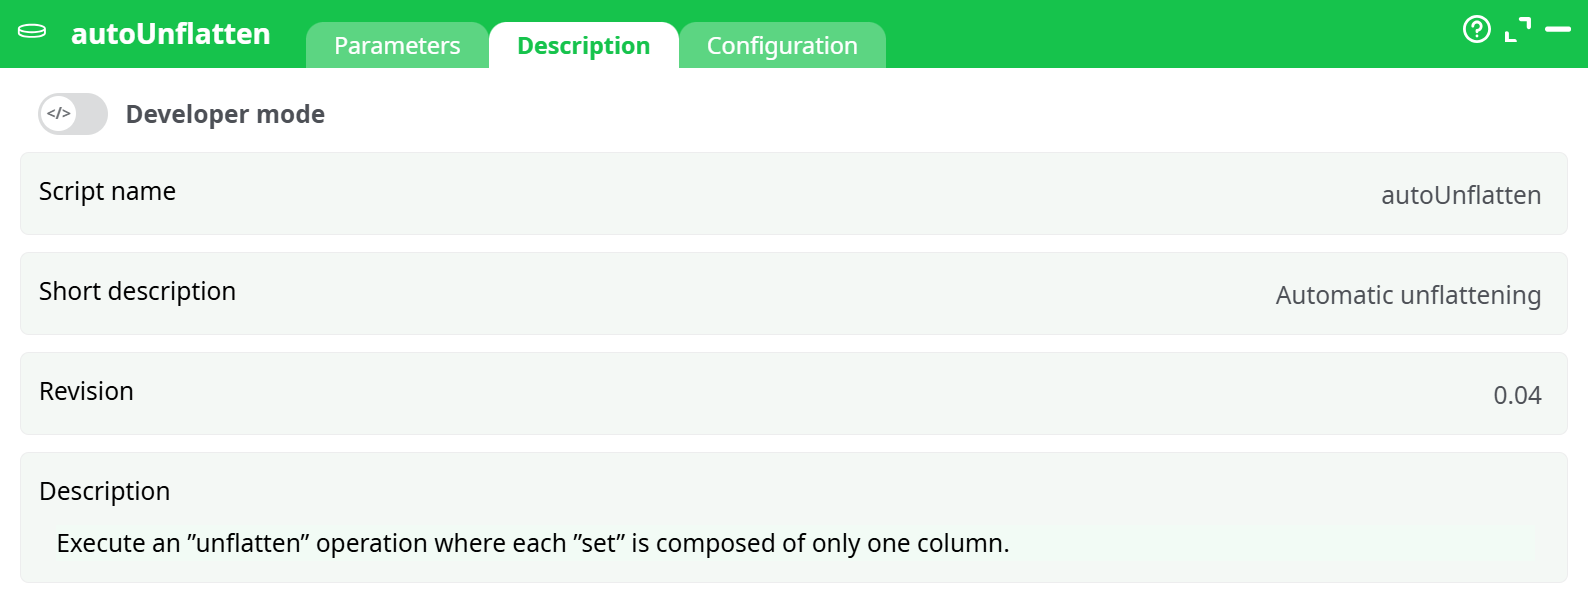
Parameters:
- Script name
- Short description
- Revision
- Decription
¶ Configuration tab
See dedicated page for more information.
¶ About
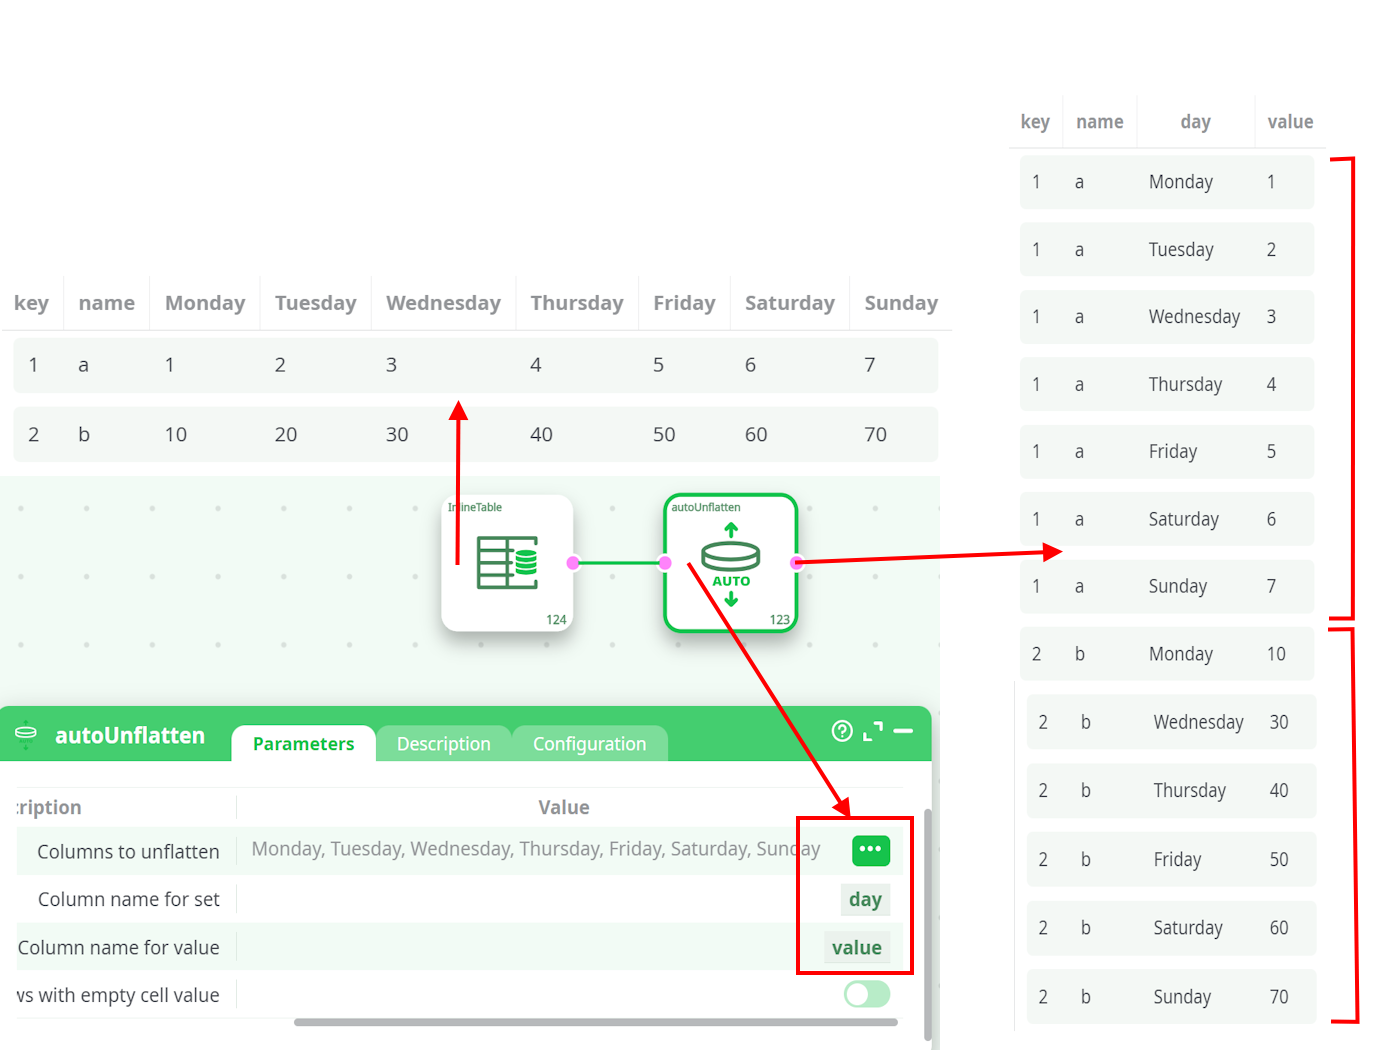
The autoUnflatten action transforms wide-format tables into a normalized vertical structure, where each original column becomes a new row. This transformation is especially useful for scenarios like time-series analysis, survey results, or repeated-measures datasets, where multiple columns represent similar types of data across categories or time.
When executed, this action:
- Identifies the selected columns to unflatten (e.g., Monday to Sunday).
- Creates two new columns in the output:
- One for the original column names (
setorday). - One for the corresponding values (
value).
- One for the original column names (
- Replicates the context of each row for each unflattened column, ensuring the other fields remain aligned.
This makes the data easier to filter, group, and visualize — especially for BI tools or downstream transformations.
¶ Example Use Case
Consider a dataset where each column (Monday, Tuesday, ..., Sunday) holds daily sales or performance metrics:
| key | name | Monday | Tuesday | Wednesday | Thursday | ... |
|---|---|---|---|---|---|---|
| 1 | a | 1 | 2 | 3 | 4 | ... |
| 2 | b | 10 | 20 | 30 | 40 | ... |
After applying autoUnflatten, it is transformed into:
| key | name | day | value |
|---|---|---|---|
| 1 | a | Monday | 1 |
| 1 | a | Tuesday | 2 |
| ... | ... | ... | ... |
| 2 | b | Wednesday | 30 |
This vertical format enables more flexible analysis, such as grouping by day or filtering for specific time ranges.
Note:
autoUnflattenis a JavaScript-based action and may be slower than the compiled C++ version (UnFlatten). If performance is a concern and the C++ version is available, consider using it instead.
¶ Here is an example: